Figure 3.
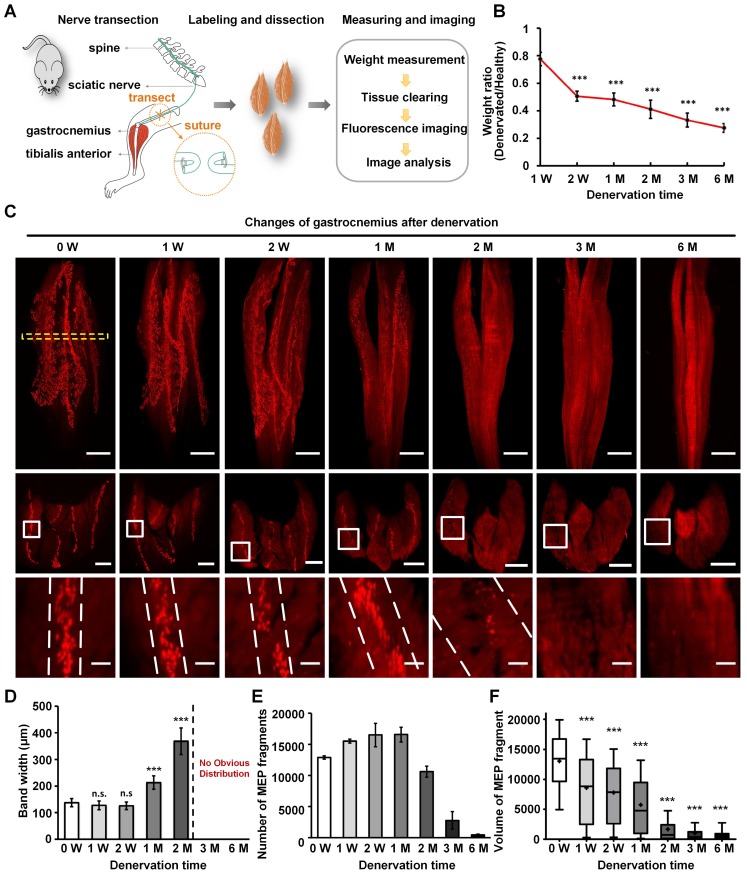
Characteristics of MEPs in the denervated gastrocnemius muscles over time. (A) A schematic diagram of the denervated mouse model. (B) Weight of the denervated gastrocnemius relative to healthy muscle. The weight ratio at 2 weeks (W), 1 month (M), 2 M, 3 M, and 6 M after denervation was significantly different from that at 1 W. ***P < 0.001 (one-way ANOVA). Data are presented as the mean ± s.d. (C) Spatial conformation of AChRs stained by α-BTX in MEPs at different time points (0 W, 1 W, 2 W, 1 M, 2 M, 3 M, and 6 M) after denervation. The cross-sectional images in the second row are maximum projections of z stacks (thickness = 250 μm), which are located at the position similar to 0 W, indicated with the yellow dotted box. The enlarged images indicated by white frames are shown in the third row. The scale bars represent 1000 μm for the first row, 500 μm for the second row, and 100 μm for the third row. (D) Band width of the lamella clusters (n = 3, 4, 6, 6, 6 mice for 0 W, 1 W, 2 W, 1 M, 2 M, respectively). n.s.: not significant; **0.001 < P < 0.01; ***P < 0.001 (one-way ANOVA followed by Dunnett's post hoc test) compared with 0 W. Note that there were no obvious MEP lamella clusters at 3 M and 6 M in (C); thus, we could not measure the data. (E) The total number of AChR-concentrated fragments in MEPs with the varying denervation times (n = 3, 4, 6, 6, 6, 5, 6 for 0 W, 1 W, 2 W, 1 M, 2 M, 3 M, 6 M, respectively). Data are presented as the mean ± s.d. (F) Box plots of the volume of a single AChR-concentrated fragment in MEP. Bars indicate the 10th and 90th percentiles. Statistical significance was assessed by the Kruskal-Wallis test. ***P < 0.001, compared with 0 W.

