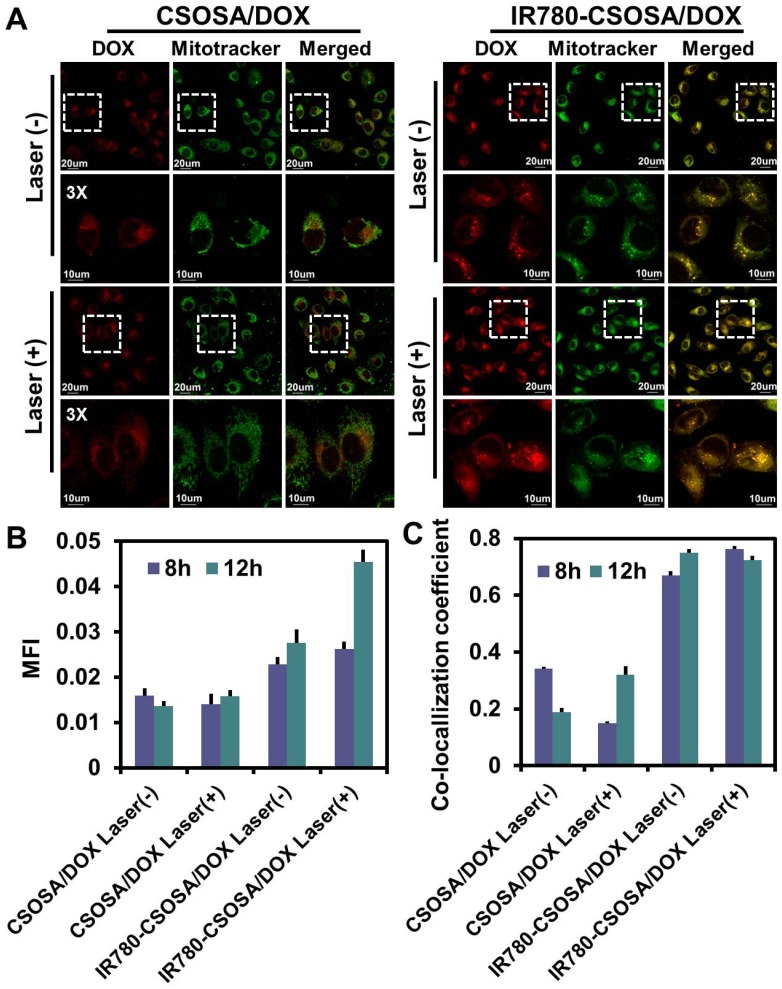
Figure 4.
NIR-triggered drug release inside mitochondria in MCF-7 cells. (A) MCF-7 cells were treated with CSOSA/DOX or IR780-CSOSA/DOX (equivalent DOX: 1.5 µg/mL) for 4 h. Next, the culture medium were replaced with fresh medium to remove the uninternalized nanoparticles and irradiated with or without laser (808 nm, 1 W/cm2) for 3 min, then continuously incubated for 4 h to observe the NIR-triggered DOX release in mitochondria by CLSM. White dotted lines denoted the corresponding magnified area. Green: Mitotracker green. Red: DOX. Yellow spots in the merged pictures denoted the co-localization of released DOX within mitochondrial compartments. (B) The mean fluorescence intensity (MFI) analysis of released DOX in the corresponding confocal images in Figure S7. (C) The co-localization coefficient of released DOX and mitochondria in the corresponding confocal images in Figure S7.

