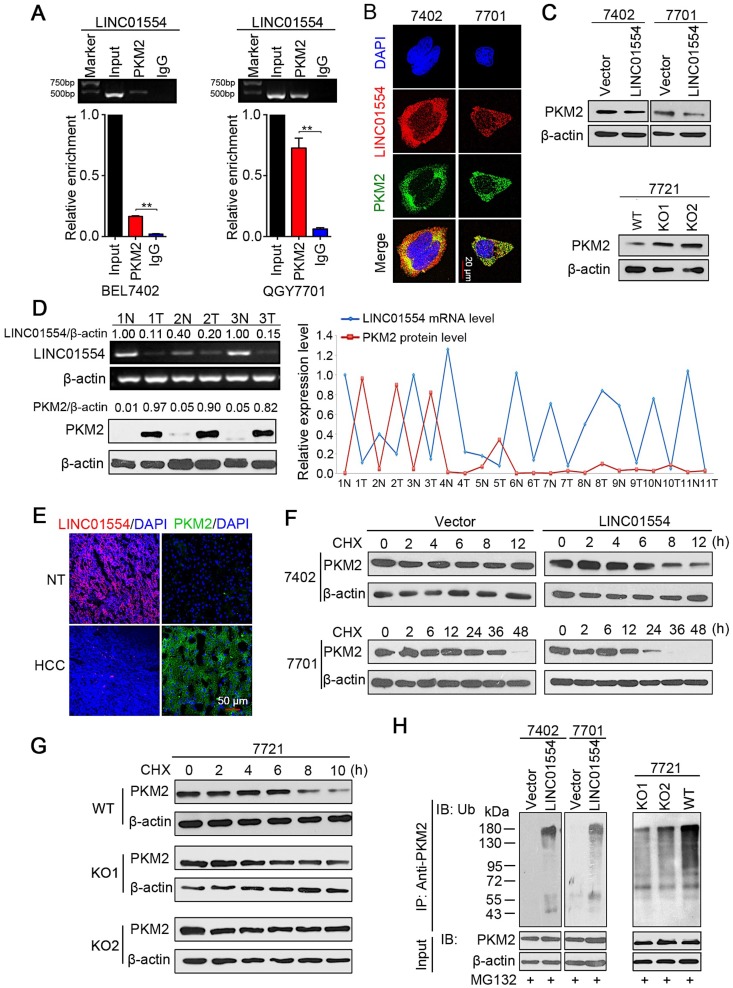
Figure 2.
LINC01554 accelerates PKM2 degradation by ubiquitin-mediated proteolysis. (A) RIP assays of LINC01554 in BEL7402 cells and QGY7701 cells using anti-PKM2 and IgG antibodies, respectively. The percentage of RIP-enriched RNA relative to input was determined by RT-PCR. Error bars represent SD in triplicate experiments (**, P < 0.01). (B) Representative images of co-staining LINC01554 (red) and PKM2 (green) in BEL7402 cells and QGY7701 cells by combination of RNA FISH and immunofluorescence. Nuclei were stained with DAPI (blue). Scale bar = 20 μm. (C) PKM2 protein levels in LINC01554-transfected cells and knockout cells were analyzed by western blotting. (D) Representative images of LINC01554 detected by RT-PCR and PKM2 by Western blotting (left). The line chart (right) revealed the negative correlation between LINC01554 and PKM2 in 11 pairs of HCC tissues and adjacent non-tumor tissues. N, non-tumor tissue; T, tumor tissue. (E) Representative images of expression of LINC01554 (red, detected by RNA FISH) and PKM2 (green, detected by immunofluorescence) in the same tumor tissue and adjacent non-tumor tissues. Scale bar = 50 μm. (F and G) CHX assays for observing PKM2 degradation rate in LINC01554-transfected cells, knockout cells and their vectors. Cells were treated with CHX (100 ng/mL) for the indicated time points. β-actin was used as a loading control. (H) in vitro ubiquitination assay in LINC01554-transfected cells, knockout cells and their vectors. All cells were incubated with MG132 (10 μM) for 10 h. Cell lysates were immunoprecipitated with anti-PKM2 antibody. The precipitates and input were analyzed by immunoblotting. Bottom panel, input of cell lysates. Vector, empty vector-transfected cells; LINC01554, LINC01554-transfected cells; WT, wild-type cells; KO, LINC01554-knockout cells.

