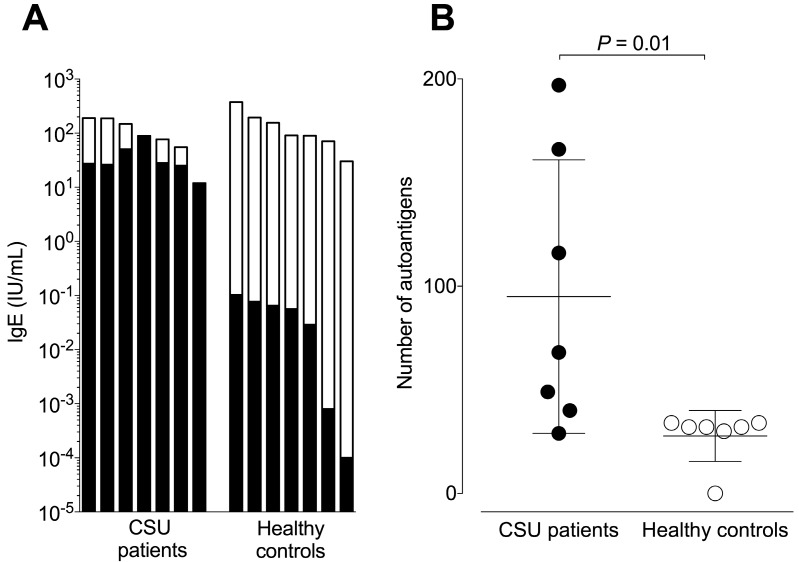
Figure 1.
CSU patients exhibit high amounts of autoreactive IgE. (A) Logarithmic plot showing total IgE levels (total column length) and autoreactive IgE levels (black areas of columns) of seven CSU patients and seven healthy controls. (B) The mean number of autoantigens recognized by IgE from seven CSU patients (95 ± 66) and seven healthy controls (28 ± 12) were significantly different (P = 0.01, Mann Whitney U test).

