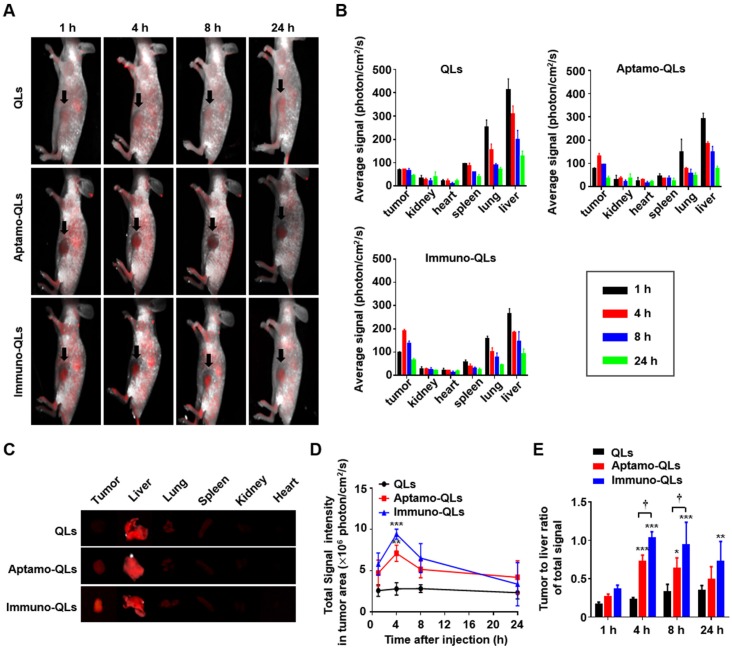
Figure 4.
In vivo fluorescence imaging of MDA-MB-231 xenografts, and biodistribution of aptamo-QLs and immuno-QLs in mice. (A) In vivo fluorescence images of tumor-bearing mice intravenously treated with QLs (upper), aptamo-QLs (middle), and immuno-QLs (lower) (0.2 mg lipid/mouse, n=3) were taken with a Maestro 2 in vivo imaging system at 1, 4, 8, and 24 h post-injection. The auto-fluorescence from mice is pseudocolored white and the unmixed QD signal is pseudocolored red. Black arrows indicate tumors. (B) After fluorescence imaging of the whole mouse body, major organs including tumors were excised and their fluorescence signals were measured at varied time points. (C) Fluorescence images of excised organs from the mice treated with QLs (upper), aptamo-QLs (middle), and immuno-QLs (lower) were captured at 4 h post-injection. (D) Changes in fluorescence signal in tumor tissues was also measured as time elapsed. (E) The tumor-to-liver ratios were compared at varied time points. Each bar represents the mean ± S.D. (n=3). *p < 0.05, **p < 0.01, ***p < 0.001 vs. QLs or †p < 0.05 between groups.

