Figure 1.
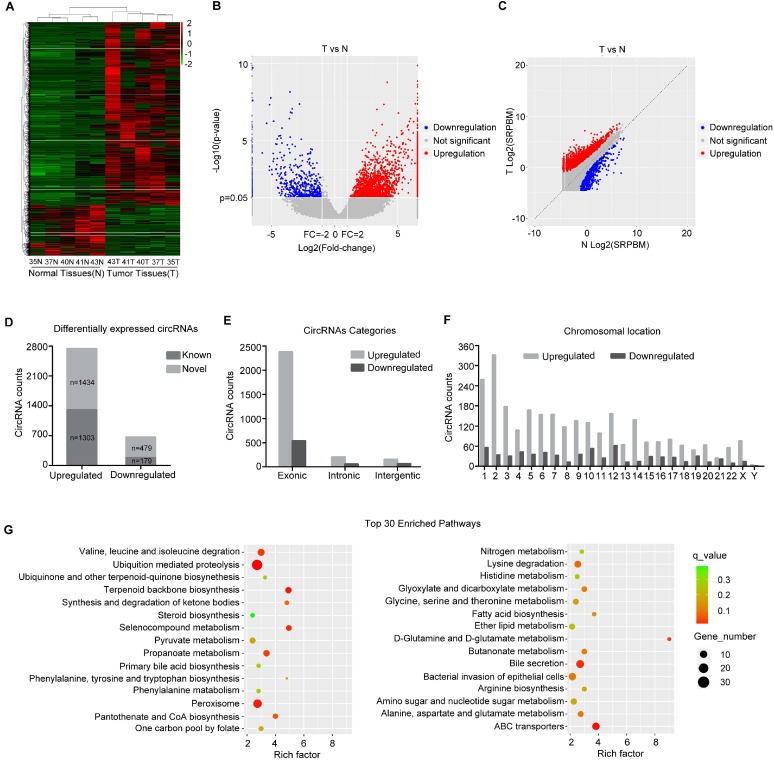
circRNA expression profile in HB. (A) Heat map depicts the differentially expressed circRNAs with a greater than 2-fold change (Z-score) in 5 paired human HB tissues and matched normal tissues. Red represents upregulated circRNAs, and green represents downregulated circRNAs. (B) The volcano plot was constructed with fold-change values and p-values. The horizontal line corresponds to a p-value of 0.05, and the vertical lines indicate upregulation and downregulation by 2-fold. The red and blue points on the volcano plot indicate the differentially expressed circRNAs with a greater than 2-fold change between the two compared groups. (C) The scatter plot was utilized to assess the variation in circRNA expression between HB and normal tissues. The x and y axes represent log2 SRPBM. The dotted line indicates the fold-change cutoff. The red and blue points indicate the significantly differentially expressed circRNAs. (D) The number of known or novel differentially expressed circRNAs. (E) Genomic origin of differentially expressed circRNAs. (F) The chromosomal distribution of differentially expressed circRNAs. (G) KEGG pathway analysis of the parental genes of differentially expressed circRNAs (Hypergeometric test). The top thirty categories are exhibited.

