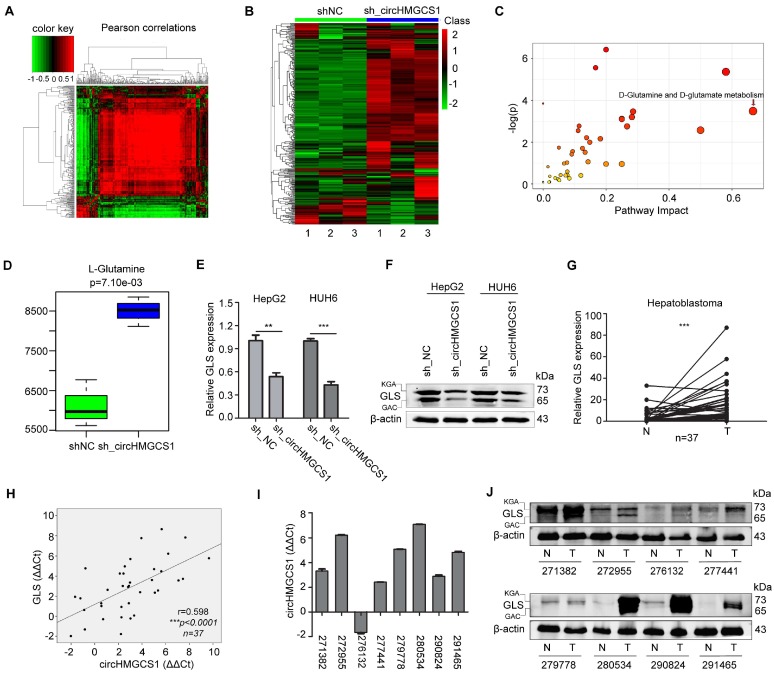
Figure 6.
CircHMGCS1 is involved in glutamine metabolism. (A) The metabolites interrelation was evaluated by Pearson's correlation. The Pearson's correlation coefficients (r) was calculated in all the samples using a pair-wise fashion. (B) The z-sore plot supplying an overview of global metabolic profiles among all the sh_NC and sh_circHMGCS1 groups. Red indicates a relatively high concentration, whereas green indicates a relatively low concentration. (C) Metabolic pathway enrichment analysis (MPEA) results (Hypergeometric test). (D) Level of L-Glutamine in sh_circHMGCS1 groups and sh_NC groups (independent-samples t test). (E) Relative mRNA expression of GLS in HepG2 and HUH6 cells infected with sh_circHMGCS1 or sh_NC was measured by qRT-PCR (independent- samples t test). (F) The protein expression of GLS in HepG2 and HUH6 cells infected with sh_NC and sh_circHMGCS1 was measured by western blotting assay. (G) Relative expression of GLS from 37 HB and normal tissue pairs was measured by qRT-PCR (paired-samples t test). N, normal tissues and T, tumor tissues. (H) Pearson's correlation analysis showing the correlation of circHMGCS1 and GLS expression in HB and normal tissue pairs (n = 37). The ΔΔCt method was applied for Pearson's correlation analysis. (I-J) The transcriptional level of circHMGCS1 (I) and the protein expression level (J) of GLS in 8 paired HB and normal tissues. GAC and KGA are the two isoforms of GLS. *p < 0.05, **p < 0.01, and ***p < 0.001.

