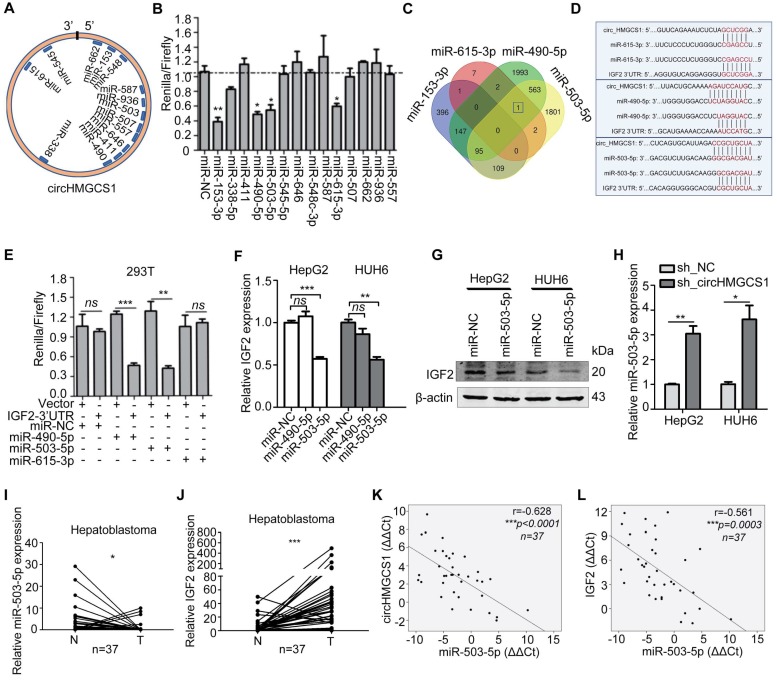
Figure 7.
CircHMGCS1 serves as a sponge for several miRNAs. (A) Schematic drawing showing the miRNAs that might bind circHMGCS1. (B) Dual-luciferase assays showing the luciferase activity of the psiCHECK2-circHMGCS1 vector in 293T cells cotransfected with several miRNA mimics. Transfection of four miRNA mimics markedly decreased the Renilla/firefly ratio in cells containing the psiCHECK2-circHMGCS1 vector compared with transfection of the miRNA mimic negative control (miR-NC) (one-way analysis of variance, Dunnett's test). (C) Venn diagram showing the mutual putative target genes of these four miRNAs. IGF2 is the mutual putative target gene of miR-490-5p, miR-503-5p and miR-615-3p. (D) The putative binding sites of miRNA (miR-490-5p/miR-503-5p/miR-615-3p) on circHMGCS1 and IGF2. (E) Dual-luciferase assays confirmed the interaction of IGF2 with miR-490-5p or miR-503-5p (independent-samples t test). (F) Relative mRNA level of IGF2 in HepG2 and HUH6 cells transfected with miR-NC, miR-490-5p or miR-503-5p were measured by qRT-PCR (one-way ANOVA followed by Dunnett's test). (G) HepG2 and HUH6 cells transfected with miR-NC or miR-503-5p were lysed to determine the levels of indicated proteins by western blotting. (H) The mRNA level of miR-503-5p in HepG2 and HUH6 cells infected with sh_circHMGCS1 or negative control (sh_NC) were measured by qRT-PCR (independent-samples t test). (I and J) Relative expression of miR-503-5p (I) and IGF2 (J) in HB and normal tissue pairs were measured by qRT-PCR (n = 37) (paired sample t test). N, normal tissues and T, tumor tissues. (K and L) Pearson's correlation analyses showing the correlation of circHMGCS1 and miR-503-5p expression (K) and the correlation of IGF2 and miR-503-5p expression (L) in HB and normal tissue pairs (n = 37). The ΔΔCt method was applied for Pearson's correlation analysis. *p < 0.05, **p < 0.01, and ***p < 0.001.

