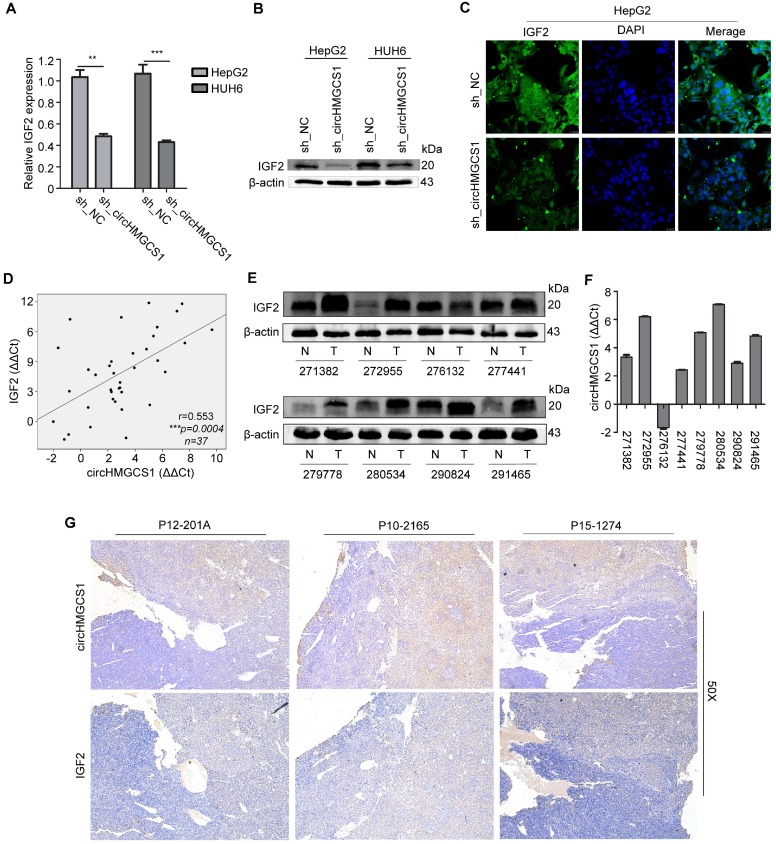
Figure 8.
CircHMGCS1 expression is positively correlated with IGF2 expression. (A and B) The mRNA level (A) and protein level (B) of IGF2 in HepG2 and HUH6 cells infected with sh_circHMGCS1 or negative control (sh_NC) were measured by qRT-PCR and western blotting, respectively (independent-samples t test). (C) HepG2 cells infected with sh_circHMGCS1 or sh_NC were subjected to IF assays to detect IGF2 expression. Representative images are shown. (D) Pearson's correlation analysis showing the correlation of circHMGCS1 and IGF2 expression in HB and normal tissue pairs (n = 37). The ΔΔCt method was applied for Pearson's correlation analysis. (E and F) The transcriptional level of circHMGCS1 (F) and the protein expression level of IGF2 (E) in 8 paired HB and normal tissues. (G) ISH and IHC were used to detect the expression pattern of circHMGCS1 and IGF2 in HB tissues by serial sections (n = 27). The representative images at 50X magnification are shown. *p < 0.05, **p < 0.01, and ***p < 0.001.

