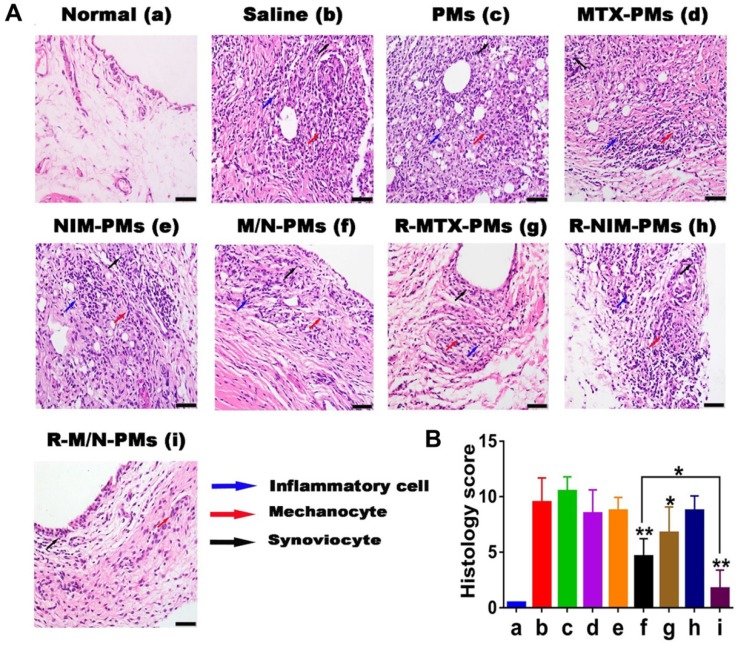
Figure 8.
Histopathology analysis of the ankle joint. (A) H&E staining. The inflammatory cells, melanocytes, and synoviocyte are marked by bold blue, red, and black arrows, respectively. The bar is 100 μm. (B) Histopathology scores. Results are shown as mean ± SD (n=5). Symbols P represented statistical significance with *P < 0.05 and **P < 0.01.

