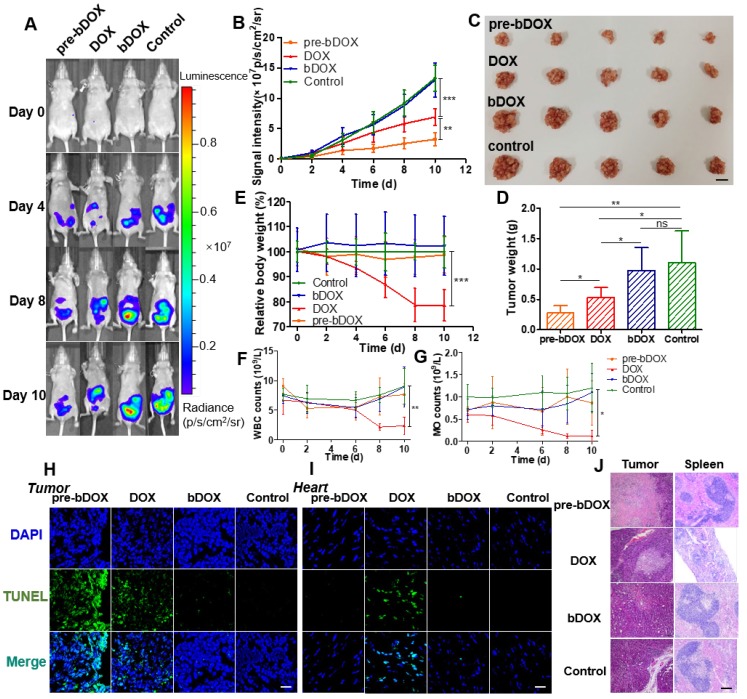
Figure 7.
In vivo evaluation of chemotherapeutic effects and side effects. (A) Representative bioluminescence images of LS180-bearing BALB/c nude mice on different days after various treatments, showing the rate of tumour growth. The mice in each group are shown in Figure S15. (B) Quantification of the relative tumour fluorescence intensity in Figure 7A and Figure S15. The values represent mean ± SD (n = 5). (C) A photograph of tumours collected from different groups after therapy (day 10). Note that tumours from one mouse were stacked into a pile. The scale bar represents 2 cm. (D) Average tumour weight per mouse for different groups, weighed and calculated from Figure 7C. The values represent mean ± SD (n = 5). (E) Relative mouse body weight of various groups during therapy. The values represent mean ± SD (n = 5). Changes in blood routine examination parameters: (F) WBC and (G) MO of various groups during therapy. The values represent mean ± SD (n = 5). TUNEL-stained frozen section of (H) tumour and (I) heart tissues after the treatments. Compared to free DOX, increased tumour cellular apoptosis and decreased cardiomyocyte apoptosis were exhibited after a treatment with pre-targeted bDOX. The scale bar represents 25 μm. (J) H&E-stained tumour and spleen tissue sections after the treatments. Compared to free DOX, increased tumour necrosis and decreased spleen damage were exhibited after a treatment with pre-targeted bDOX. The scale bar represents 100 μm. * p < 0.05; ** p < 0.01; *** p < 0.001. (MO: monocytes; ns: no significance; pre-bDOX: pre-targeted bDOX; WBC: white blood cells).

