

Abstract
Objective:
The objective of this study was to evaluate and correlate hematologic indices, vitamin B12 levels, and depression in patients with suspected laryngopharyngeal reflux (LPR) treated with proton pump inhibitor (PPI).
Methods:
This was a prospective study with a population (n = 23) consisted of patients with suspected LPR and treated with 2 daily doses of Omeprazole 40 mg (80 mg or full dose). The study volunteers performed a complete blood count and vitamin B12 dosage before and after 3 and 6 months of treatment, as well as depression screening using the Center of Epidemiologic Studies-Depression (CES-D) questionnaire before and after 6 months of treatment. Scores greater than 16 were considered as suggestive of depression.
Results:
The mean score on the CES-D scale of study participants at baseline significantly decreased after 6 months of treatment. A significant decrease was observed in the red blood cells count (RBC) after 6 months in relation to 3 months. Significant increases in mean corpuscular volume (MCV) and mean corpuscular hemoglobin (MCH) were observed from 3 months to 6 months in this study. Vitamin B12 levels increased significantly between baseline and after 6 months of treatment.
Conclusion:
Decreased scores on the CES-D scale were associated with increased MCV values, with no association with vitamin B12 levels. However, vitamin B12 levels also increased significantly after 6 months of treatment with PPI.
Keywords: Laryngopharyngeal reflux, proton pump inhibitor, B12 vitamin, blood count, depression
Introduction
Laryngopharyngeal reflux (LPR) is defined as the retrograde flow of stomach contents to the larynx and pharynx and the contact of this material with the upper aerodigestive tract.1 Typical symptoms of LPR include dysphonia, pharyngeal globus, mild dysphagia, chronic cough, and throat clearing2; it is estimated that up to 15% of visits to the otolaryngologist are related to the LPR.3
Considering the low specificity of the laryngoscopic examination and the low sensitivity of pHmetry, the most accepted method used in clinical practice to suggest the diagnosis of LPR is the empirical treatment with a proton pump inhibitor (PPI).2,4 These medications are the most potent available for decreasing gastric acidity. They are currently among the most prescribed drugs, due to their high efficacy and safety.5,6 Empirical treatment consists of the use of PPIs twice a day for 2 to 3 months.7 Although most patients show some improvement after 3 months of treatment, resolution of symptoms and improvement of laryngeal findings usually occurs after 6 months.1,8
In addition to preventing the upper airway from exposure to stomach acid, PPIs also reduce the damage resulting from the enzymatic activity of pepsin, which requires an acidic medium for its activation.9 Although these drugs are considered safe and approved for long-term use, some questions about the safety of continued use, specifically regarding absorption of B-complex vitamins, have been raised.6,10
Studies have shown that long-term use (more than 12 months) of PPI is associated to reduction in the blood levels of vitamin B12.11,12 Even the short-term use of PPI has been shown to decrease the blood levels of vitamin B12.11,13,14 Long-term use of PPI is believed to be associated with vitamin B12 deficiency in 2 ways: first, by the decrease in gastric acidity, which impairs the release of vitamin B12 from the proteins in the stomach; second, by the increase in gastric pH that would favor the growth of bacteria in the intestine, reducing the absorption of this vitamin.15,16
Vitamin B12 deficiency may result in hematologic and neurological problems.16,17 It is classically associated with megaloblastic anemia and neuropsychiatric disorders, such as paresthesia, psychosis, mental confusion, and depression.16,18
The positive relationship between vitamin B12 deficiency and depression would be due to the fact that this vitamin is involved in the metabolic pathway leading to the formation of S-adenosyl methionine (SAM), a methylating agent that is necessary in the metabolism of neurotransmitters.19–22
Depression is a relatively common condition in patients with LPR. It is estimated that more than 50% of these patients present with depressive symptoms during the course of treatment with PPI, ranging from minor to severe symptoms.23 One of the causes of depression in these patients would be deficiency of B-complex vitamins, especially vitamin B12.19,21,22
Depression is a psychopathological construct not directly evaluated by objective measures. Its identification depends on reports of behaviors and symptoms considered as part of a syndrome. Inventories and scales that record the presence and frequency of depressive symptoms were constructed with the objective of tracking, identifying, and evaluating the intensity and presentation of these symptoms.24
The aim of this study is to evaluate and correlate hematologic parameters, vitamin B12 levels, and depression in patients with LPR-related symptoms treated with PPI.
Materials and Methods
Design
This was a prospective study held between December 2016 and August 2017.
Population sample
The sample consisted of 23 patients with suspected LPR and treated with PPIs. The patients were attended at the otorhinolaryngology outpatient clinic of the Clinical Hospital of Rio Branco (Acre, Brazil), between December 2016 and August 2017.
Inclusion criteria included clinical symptoms of LPR, such as dysphonia, pharyngeal globus, mild dysphagia, chronic cough and throat clearing, and the presence of signs of LPR in the videolaryngoscopy examination. The signs that were considered suggestive of LPR were edema and erythema of the larynx, lymphoid hyperplasia of the posterior wall of the larynx, and the presence of granulomas. Patients who had clinical symptoms and suggestive signs of LPR in the videolaryngoscopy examination were considered eligible to enter the study. Other inclusion criterion was age above 18 years. Only patients younger than 18 years were excluded (Figure 1).
Figure 1.
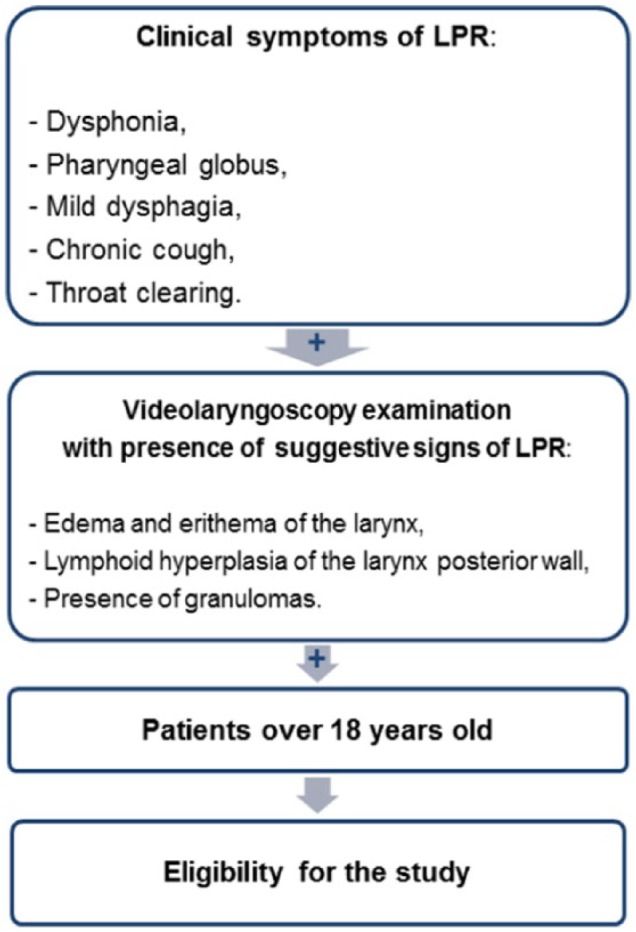
Inclusion criteria used in the study.
Of the 23 study participants, 20 were women and 3 were men. The age median (Q1-Q3) was 51.5 (38.5-59.0) years. The average ± standard deviation values of body weight in the first, second, and third moments of the study were 67.8 ± 2.39, 66.8 ± 2.47, and 66.52 ± 2.27 kg, respectively. The median height (Q1-Q3) was 1.55 (1.52-1.6) m.
This study was approved by the Research Ethics Committee of the Federal University of Acre under registry number 1,806,320. Eligible individuals signed free and informed consent terms.
Hematologic evaluations and therapy
Volunteers who met the inclusion criteria and agreed to voluntarily participate in the study had an evaluation of their complete blood count and vitamin B12 dosage every 3 months in a 6-month period, totaling 3 determinations. Treatment with PPIs consisted of 2 daily doses of Omeprazole 40 mg (80 mg or full dose).
The blood cell count was done using the electrical impedance method in an Abbott-Cell-Dyn 3700 analyzer (Abbott Diagnostics Division, Mountain View, CA, USA). The dosages of vitamin B12 were done by electrochemiluminescence in a Roche Cobas 6000 e601 analyzer (Roche Diagnostics, Indianapolis, IN, USA). Vitamin B12 values between 211 and 926 pg/mL were considered normal.
Screening for depression
The volunteers were submitted to the depression screening questionnaire titled Center of Epidemiologic Studies-Depression (CES-D) at the beginning and end of the treatment, being considered as suggestive of depression scores greater than 16. CES-D is a scale elaborated by the National Institute of Mental Health (USA) that has been translated and validated to be used in parts of the world, including Brazil.24,25
Data analysis
The comparison between the different moments of the study was done using analysis of variance (ANOVA) for repeated measures when the data distribution for that variable was normal. When there was no normal distribution in any of the study times or when there was violation of sphericity, the comparisons were made using Friedman ANOVA, followed by the Wilcoxon post-test, adjusted with the Bonferroni correction to avoid that the inflation of the P value implied in the occurrence of type 1 error.
For the generation of the correlation matrix, all 3 moments were considered, totaling a value of n of about 69 measurements for each variable. Initially, Pearson and Spearman correlation matrices were generated, and then they were merged into a single matrix. In the final matrix, the values of the Pearson (r) or Spearman (ρ) coefficients were considered when both correlated variables presented normal distribution or when one or both of the correlated variables presented a non-normal distribution, respectively. Data were analyzed using SPSS 22 (IBM Corporation, Chicago, IL, USA).
Results
The values of the variables analyzed in the study population before and after 3 and 6 months of treatment are presented in Table 1.
Table 1.
Values of hematologic variables, vitamin B9 and B12 concentrations, and depression scores at baseline and after 3 and 6 months of laryngopharyngeal reflux treatment with proton pump inhibitor.
| Reference range | Baseline | After 3 months | After 6 months | |
|---|---|---|---|---|
| Age (years) | – | 51.5 (38.5-59.0) | – | – |
| Height (m) | – | 1.6 (1.5-1.6) | – | – |
| CES-D (score) | 0-60 | 14.0 (8.5-24.5)* | 9 (5-16)* | |
| Weight (kg) | – | 67.8 ± 2.4 | 66.8 ± 2.47 | 66.5 ± 2.3 |
| RBC (million/mm3) | 4.5-6.1 (M) 3.9-5.4 (F) |
4.7 ± 0.1 | 4.7 ± 0.09* | 4.6 ± 0.08* |
| Hemoglobin (g/dL) | 12.8-16.3 (M) 11.3-14.5 (F) |
13 (12.6-14.4) | 13.2 (12.6-14.3) | 13.1 (12.7-14.3) |
| Hematocrit (%) | 40-54 (M) 36-48 (F) |
39.5 (38.1-42.6) | 39.8 (38.6-43.6) | 39.5 (38.5-42.6) |
| MCV (fL) | 78-100 | 87.2 ± 0.9 | 86.5 ± 0.9* | 88.8 ± 0.9* |
| MCH (pg) | 26-32 | 29.0 ± 0.4 | 28.7 ± 0.4* | 29.5 ± 0.3* |
| MCHC (g/dL) | 31-36 | 33.3 (32.6-33.8) | 32.9 (32.6-33.7) | 33.3 (33.0-33.7) |
| RDW (%) | 11.5-15.5 | 12.2 (12.2-12.2) | 15.9 (15.4-16.0) | 15.0 (13.9-15.2) |
| Platelet (103/mm3) | 150-450 | 226.7 ± 6.56 | 230.4 ± 7.1 | 233.1 ± 9.6 |
| Leucocyte (103/mm3) | 4.0-11.0 | 7.2 ± 0.5 | 6.4 ± 0.3 | 6.5 ± 0.3 |
| Vitamin B9 (ng/mL) | 3.1-17.5 | 10.7 ± 0.8 | 10.9 ± 0.4 | 13.1 ± 0.9 |
| Vitamin B12 (pg/mL) | 211-926 | 341.0 (262.0-410.0)* | 313.0 (253.0-503.0) | 413.5 (293.1-553.0)* |
Abbreviations: ANOVA, analysis of variance; CES-D, Center of Epidemiologic Studies-Depression Scale; MCH, mean corpuscular hemoglobin; MCHC, mean corpuscular hemoglobin concentration; MCV, mean corpuscular volume; RBC, red blood cells count; RDW, red-cell distribution width.
P < .05 indicates statistically significant difference between study moments when compared by ANOVA for repeated measures (for data with normal distribution and represented as mean ± SD) and Friedman ANOVA with Wilcoxon post-test and Bonferroni correction (for data with non-normal distribution and represented as median [Q1-Q3]).
In this study, the average CES-D score of the participants at the initial time of the study was 14 (8.5-24.5) and the median value after 6 months of treatment was 9 (5-16). As this difference was statistically significant (P = .01), there was improvement in the mean score on the depression screening scale (Table 1), possibly associated with clinical improvement of the study volunteers after 6 months of treatment.
A significant decrease was observed in the red blood cell (RBC) count after 6 months (T3) in relation to 3 months (T2) after beginning on treatment (Table 1). However, no difference was observed in relation to hemoglobin concentration and hematocrit values, which are variables that are conceptually associated with RBC counts and that, therefore, showed strong correlations with this variable (Table 2).
Table 2.
Spearman (r) or Pearson (ρ) correlation coefficients for pairs of variables with non-normal (0) or normal (1) distribution, respectively.
| No. | Variable | Distribution | 1 |
2 |
3 |
4 |
5 |
6 |
7 |
8 |
9 |
10 |
11 |
12 |
13 |
14 |
15 |
|---|---|---|---|---|---|---|---|---|---|---|---|---|---|---|---|---|---|
| 0 | 0 | 0 | 1 | 1 | 0 | 0 | 0 | 1 | 0 | 1 | 1 | 1 | 0 | 0 | |||
| 1 | Age | 0 | 1.0 | ||||||||||||||
| 2 | Height | 0 | –0.2* | 1.0 | |||||||||||||
| 3 | CES-D | 0 | –0.2 | 0.0 | 1.0 | ||||||||||||
| 4 | Weight | 1 | –0.2 | 0.8§ | 0.3 | 1.0 | |||||||||||
| 5 | RBC | 1 | –0.1 | 0.2 | 0.1 | 0.4§ | 1.0 | ||||||||||
| 6 | Hemoglobin | 0 | –0.2 | 0.4§ | 0.0 | 0.5§ | 0.8§ | 1.0 | |||||||||
| 7 | Hematocrit | 0 | –0.1 | 0.4§ | 0.0 | 0.5§ | 0.8§ | 0.9§ | 1.0 | ||||||||
| 8 | MCV | 0 | 0.0 | 0.2 | −0.3* | 0.1 | –0.4§ | 0.1 | 0.1 | 1.0 | |||||||
| 9 | MCH | 1 | –0.1 | 0.2 | −0.3 | 0.1 | –0.3* | 0.3* | 0.2 | 0.9§ | 1.0 | ||||||
| 10 | MCHC | 0 | –0.3* | 0.1 | 0.1 | 0.1 | 0.1 | 0.5§ | 0.2 | 0.2* | 0.5§ | 1.0 | |||||
| 11 | RDW | 1 | –0.2 | −0.2 | 0.2 | 0.0 | –0.1 | –0.3 | −0.2 | –0.4* | –0.4 | –0.3 | 1.0 | ||||
| 12 | Platelet | 1 | 0.0 | 0.0 | −0.1 | 0.0 | –0.2 | –0.3* | −0.3* | –0.1 | –0.1 | –0.2 | –0.3 | 1.0 | |||
| 13 | Leucocyte | 1 | 0.0 | 0.2 | −0.2 | 0.1 | 0.2 | 0.2 | 0.2 | 0.0 | 0.0 | –0.1 | 0.0 | 0.3* | 1.0 | ||
| 14 | Vitamin B9 | 0 | 0.2 | –0.1 | −0.2 | –0.3* | –0.2 | −0.1 | −0.1 | 0.0 | 0.0 | –0.1 | 0.0 | 0.0 | –0.1 | 1.0 | |
| 15 | Vitamin B12 | 0 | 0.0 | –0.1 | −0.1 | 0.0 | 0.0 | −0.1 | −0.1 | 0.0 | 0.0 | 0.0 | 0.2 | 0.2 | 0.3* | 0.3* | 1.0 |
Abbreviations: CES-D, Center of Epidemiologic Studies-Depression Scale; MCH, mean corpuscular hemoglobin; MCHC, mean corpuscular hemoglobin concentration; MCV, mean corpuscular volume; RBC, red blood cells; RDW: red-cell distribution width.
P < .05; §P < .01.
Significant increases in the values of mean corpuscular volume (MCV) and mean corpuscular hemoglobin (MCH) were observed from T2 to T3 in this study (Table 1). A trivial cause of elevation in MCV values are deficiencies of vitamin B9 and/or B12.26 However, there was no decrease in the levels of these vitamins after 6 months of treatment. There was also no significant correlation between MCV and MCH values with blood levels of those vitamins in the study population (Table 2).
Discussion
In patients with LPR, occurrence of depression compared with a control group has been reported in several studies.27,28 In one of these studies, after treatment with omeprazole for 3 months, the patients showed improvement in quality-of-life scores, without significant difference in the score of the instrument used to estimate the occurrence of depression.27
The literature suggests that psychiatric and reflux symptoms may not be mutually exclusive.23 On one hand, depression and anxiety can aggravate LPR symptoms. On the other hand, the presence of reflux itself may contribute to a worse psychological state.29 In this way, it is often difficult to know which of the symptoms first began, the neuropsychiatric or the LPR symptom. But, of course, the issue is much more complex, because more than 50% of patients with LPR receiving PPI develop depression,23 which has been associated with deficiency of B-complex vitamins, especially vitamin B12.19,21,22
A retrospective study of PPI users for more than 1 year revealed a decrease in mean hemoglobin, hematocrit, and MCV. The author suggested that the cause would be a lower iron absorption by the PPI users,30 because the acid produced in the stomach would facilitate the absorption of nonheme iron from the diet by converting it to its absorbable ferrous form.31 However, there are few studies in the literature that have investigated the association between long-term use of PPI and iron deficiency.
In this study, in addition to a decrease in RBC and an increase in MCV and MCH, there was also a decrease in RBC with both MCV and MCH increase (Table 2). The negative correlation of RBC with MCV suggests a tendency to macrocytic anemia with the increase in the time of treatment with PPI, which could be trivially attributed to the development of deficiency of vitamin B9 and/or B12.11 Paradoxically, however, vitamin B12 levels increased significantly between baseline and after 6 months of treatment (Table 1).
Meta-analysis on the use of PPIs for 10 or more months showed an increased risk of developing vitamin B12 deficiency.32 This effect was shown to be dose-dependent.11,33 However, this deficiency may not manifest itself in short-term treatments,34 as was the case in this study. Indeed, under normal circumstances, the decline in blood levels of vitamin B12 may take years to occur.16,35
As there are studies that have also found no association of the use of PPIs with vitamin B12 deficiency,35 it is possible that the time of use may not have been sufficient to promote a significant decrease of serum levels of vitamin B12, despite the high dose of PPI used in this study. However, it is not possible to explain why the patients achieved a significant increase in this vitamin after treatment, rather than maintaining pre-therapy serum levels. In any case, it is important to emphasize that the changes reported in this study occurred in the context of a high dose of PPI, which although is within the limits of standardization of this drug, does not correspond to the use of 2 doses of 20 mg employed by most studies.
It is important to note that the significant drop in the CES-D scores at the end of 6 months of PPI treatment (Table 1), as previously mentioned, is consistent with the observed increase in vitamin B12 levels after 6 months of study, because depression was associated with deficiency of B vitamins, especially vitamin B12.19,21,22
The fact that there was a significant association of the decrease in the scores of the CES-D scale with the increase in the MCV values (Table 2) is consistent with the decrease in the scores of the CES-D scale and the increase in MCV observed at the end of 6 months of treatment with PPI (Table 1). However, these findings do not confirm previous literature findings that the use of PPIs would lead to a decline in vitamin B12 absorption, which would result in simultaneous increases in MCV values and CES-D scores.
The association of vitamin B12 deficiency with depression is not an absolute finding in the literature. Several studies, like this study, did not find this relationship,36-38 which suggests that research in this area should be continued to better elucidate this issue. It is important to emphasize that the clinical diagnosis of depression was not made during this study, which used a scale whose elevated scores only suggest the existence of depression, and it is possible that patients with quality-of-life impairment for several reasons, including the LPR itself, may have higher scores on this scale even without depression.
In our study, unlike others who investigated the association of depression with vitamin B12, patients were being treated for LPR, which in itself is already a factor related to depression. As the symptoms of LPR tend to improve with treatment, this may have been a confounding factor.
The limitations of this study include the absence of clinical tools, such as pHmetry, to confirm the diagnosis of LPR. Although many physicians use a therapeutic approach with PPI to confirm the diagnosis,2 this procedure is not perfect, due to the existence of a significant number of patients with non-acidic or mixed LPR.
Another limitation is the lack of use of other methods to estimate the early deficiency of vitamin B12, such as plasma homocysteine and methylmalonic acid dosage, because the normal reference range of vitamin B12 is very broad. Even though the increase in vitamin B12 was significant, the results still remained within the reference range. The study could have been developed for a longer time, to better assess changes in hematologic parameters over time.
A major limitation was the lack of evaluation of serum iron and ferritin levels. After all, reduction of stomach acid may decrease the absorption of iron, which could result in anemia.30 At least, iron deficiency would affect hematologic variables, as the reduction of iron levels in the body tends to cause hypochromia and microcytosis.39 In addition, it is important to highlight that the lack of assessment of red-cell distribution width (RDW) in all patients must have interfered in the results related to this variable.
The use of CES-D instead of the clinical diagnosis of depression may have been a limitation in the interpretation of the findings, even though the CES-D has already been used in other studies with this same purpose.40
Moreover, the low number of men in the study may have interfered with the results, both because menstrual blood losses in women may influence the variables analyzed and because women are more susceptible to depression.
As all patients with suspected LPR are instructed to modify their diets and lifestyle, it is possible that these changes have affected the study results. However, dietary and lifestyle influences were not analyzed in this study.
Finally, other confounding factors not reported by the patient, such as changes in diet, use of vitamin supplements, and other psychiatric disorders may also have interfered with the results. It also important to note that other disorders, such as long-term rhinosinusitis, allergy, diabetes, and long-term consumption of tobacco and/or alcohol, which have common symptoms with LPR, may have affected the results.
Studies such as this are extremely important in assessing the safety of continued use of medications, such as PPIs, which are widely used in clinical practice today. However, further studies need to be developed to corroborate the findings reported in this study or in studies previously conducted in the scientific literature, not only regarding the use of PPIs and vitamin B12 decrease but also in relation to the association between deficiency of this vitamin and depression.
Conclusions
The use of PPI (Omeprazole 80 mg/day) for 6 months in patients with suspected LPR may has led to a decrease in the number of RBCs and an increase in MCV, MCH, and vitamin B12. After 6 months of treatment, there was improvement in the scores of a tool used for depression estimation (CES-D). The decrease in the CES-D scores was associated with an increase in MCV values, with no relation to vitamin B12 levels.
Footnotes
Funding:The author(s) received no financial support for the research, authorship, and/or publication of this article.
Declaration of conflicting interests:The author(s) declared no potential conflicts of interest with respect to the research, authorship, and/or publication of this article.
Author Contributions: All authors contributed equally in the design and execution of the study and in preparing this paper.
ORCID iD: Rebecca Heidrich Thoen Ribeiro  https://orcid.org/0000-0002-9026-4696
Nilson Penha-Silva
https://orcid.org/0000-0002-8205-6213
References
- 1. Ford CN. Evaluation and management of laryngopharyngeal reflux. JAMA. 2005;294:1534–1540. [DOI] [PubMed] [Google Scholar]
- 2. Abou-Ismail A, Vaezi MF. Evaluation of patients with suspected laryngopharyngeal reflux: a practical approach. Curr Gastroenterol Rep. 2011;13:213–218. [DOI] [PubMed] [Google Scholar]
- 3. Vaezi MF. Laryngitis: from the gastroenterologist’s point of view. In: Vaezi MF. ed. Extraesophageal Reflux. San Diego, CA: Plural; 2009:37–47. [Google Scholar]
- 4. Sataloff RT, Hawkshaw MJ, Gupta R. Laryngopharyngeal reflux and voice disorders: an overview on disease mechanisms, treatments, and research advances. Discov Med. 2010;10:213–224. [PubMed] [Google Scholar]
- 5. IMS Health. A review of the use of medicines in the United States in 2012. www.imshealth.com/deployedfiles/ims/Global/Content/Insights/IM2013.
- 6. Ali T, Roberts DN, Tierney WM. Long-term safety concerns with proton pump inhibitors. Am J Med. 2009;122:896–903. [DOI] [PubMed] [Google Scholar]
- 7. Kahrilas PJ, Shaheen NJ, Vaezi MF. American Gastroenterological Association Institute technical review on the management of gastroesophageal reflux disease. Gastroenterology. 2008;135:1392.e5–1413.e5. [DOI] [PubMed] [Google Scholar]
- 8. Bove MJ, Rosen C. Diagnosis and management of laryngopharyngeal reflux disease. Curr Opin Otolaryngol Head and Neck Surg. 2006;14:116–123. [DOI] [PubMed] [Google Scholar]
- 9. Dobhan R, Castell DO. Normal and abnormal proximal esophageal acid exposure: results of ambulatory dual-probe pH monitoring. Am J Gastroenterol. 1993;88:25–29. [PubMed] [Google Scholar]
- 10. Garnett WR. Considerations for long-term use of proton-pump inhibitors. Am J Health Syst Pharm. 1998;55:2268–2279. [DOI] [PubMed] [Google Scholar]
- 11. Marcuard SP, Albernaz L, Khazanie PG. Omeprazole therapy causes malabsorption of cyanocobalamin (vitamin B12). Ann Intern Med. 1994;120:211–215. [DOI] [PubMed] [Google Scholar]
- 12. Termanini B, Gibril F, Sutliff VE, Yu F, Venzon DJ, Jensen RT. Effect of long-term gastric acid suppressive therapy on serum vitamin B12 levels in patients with Zollinger-Ellison syndrome. Am J Med. 1998;104:422–430. [DOI] [PubMed] [Google Scholar]
- 13. Saltzman JR, Kemp JA, Golner BB, Pedrosa MC, Dallal GE, Russell RM. Effect of hypochlorhydria due to omeprazole treatment or atrophic gastritis on protein-bound vitamin B12 absorption. J Am Coll Nutr. 1994;13:584–591. [DOI] [PubMed] [Google Scholar]
- 14. Schenk BE, Festen HP, Kuipers EJ, Klinkenberg-Knol EC, Meuwissen SG. Effect of short- and long-term treatment with omeprazole on the absorption and serum levels of cobalamin. Aliment Pharmacol Ther. 1996;10:541–545. [DOI] [PubMed] [Google Scholar]
- 15. Abraham NS. Proton pump inhibitors: potential adverse effects. Curr Opin Gastroenterol. 2002;28:615–620. [DOI] [PubMed] [Google Scholar]
- 16. Kapadia C. Cobalamin (vitamin B12) deficiency: is it a problem for our aging population and is the problem compounded by drugs that inhibit gastric acid secretion? J Clin Gastroenterol. 2000;30:4–6. [DOI] [PubMed] [Google Scholar]
- 17. Durand P, Prost M, Loreau N, Lussier-Cacan S, Blache D. Impaired homocysteine metabolism and atherothrombotic disease. Lab Invest. 2001;81:645–672. [DOI] [PubMed] [Google Scholar]
- 18. Langan RC, Zawistoski KJ. Update on vitamin B12 deficiency. Am Fam Physician. 2011;83:1425–1430. [PubMed] [Google Scholar]
- 19. Alpert JE, Mischoulon D, Nierenberg AA, Fava M. Nutrition and depression: focus on folate. Nutrition.2000;16:544–546. [DOI] [PubMed] [Google Scholar]
- 20. Coppen A, Bolander-Gouaille C. Treatment of depression: time to consider folic acid and vitamin B12. J Psychopharmacol. 2005;19:59–65. [DOI] [PubMed] [Google Scholar]
- 21. Penninx BWJH, Guralnik JM, Ferrucci L, Fried LP, Allen RH, Stabler SP. Vitamin B(12) deficiency and depression in physically disabled older women: epidemiologic evidence from the Women’s Health and Aging Study. Am J Psychiatry. 2000;157:715–721. [DOI] [PubMed] [Google Scholar]
- 22. Reynolds E. Vitamin B12, folic acid, and the nervous system. Lancet Neurol. 2006;5:949–960. [DOI] [PubMed] [Google Scholar]
- 23. Oyer SL, Anderson LC, Halum SL. Influence of anxiety and depression on the predictive value of the reflux symptom index. Ann Otol Rhinol Laryngol. 2009;118:687–692. [DOI] [PubMed] [Google Scholar]
- 24. Batistoni SST, Néri AL, Cupertino AP. Validade e confiabilidade da versão brasileira da Center for Epidemiological Scale—Depression (CES-D) em idosos brasileiros. Psico-USF. 2010;15:13–22. [Google Scholar]
- 25. da Silveira DX, Jorge MR. Reliability and factor structure of the Brazilian version of the Center for Epidemiologic Studies-Depression. Psychol Rep. 2002;91:865–874. [DOI] [PubMed] [Google Scholar]
- 26. Green R, Datta Mitra A. Megaloblastic anemias: nutritional and other causes. Med Clin North Am. 2017;101:297–317. [DOI] [PubMed] [Google Scholar]
- 27. Siupsinskiene N, Adamonis K, Toohill RJ. Quality of life in laryngopharyngeal reflux patients. Laryngoscope. 2007;117:480–484. [DOI] [PubMed] [Google Scholar]
- 28. Young-Hoon J, Young-Su S, Chi-Un P. Relationship between depression and laryngopharyngeal reflux. Psychiatry Investig. 2017;14:226–229. [DOI] [PMC free article] [PubMed] [Google Scholar]
- 29. Carrau R, Khidr A, Crawley J, Hillson E, Davis J, Pashos C. The impact of laryngopharyngeal reflux on patient-reported quality of life. Laryngoscope. 2004;114:670–674. [DOI] [PubMed] [Google Scholar]
- 30. Sarzynski E, Puttarajappa C, Xie Y, Grover M, Laird-Fick H. Association between proton pump inhibitor use and anemia: a retrospective cohort study. Dig Dis Sci. 2011;56:2349–2353. [DOI] [PubMed] [Google Scholar]
- 31. Bezwoda W, Charlton R, Bothwell T, Torrance J, Mayet F. The importance of gastric hydrochloric acid in the absorption of nonheme food iron. J Lab Clin Med. 1978;92:108–116. [PubMed] [Google Scholar]
- 32. Jung SB, Nagaraja V, Kapur A, Eslick GD. Association between vitamin B12 deficiency and long-term use of acid lowering agents: a systematic review and meta-analysis. Intern Med J. 2015;45:409–416. [DOI] [PubMed] [Google Scholar]
- 33. Lam JR, Schneider JL, Zhao W, Corley DA. Proton pump inhibitor and histamine 2 receptor antagonist use and vitamin B12 deficiency. JAMA. 2013;310:2435–2442. [DOI] [PubMed] [Google Scholar]
- 34. Valuck RJ, Ruscin JM. A case-control study on adverse effects: H2 Blocker or proton pump inhibitor use and risk of vitamin B12 deficiency in older adults. J Clin Epidemiol. 2004;57:422–428. [DOI] [PubMed] [Google Scholar]
- 35. den Elzen WP, Groeneveld Y, de Ruijter W, et al. Long-term use of proton pump inhibitors and vitamin B12 status in elderly individuals. Aliment Pharmacol Ther. 2008;15:491–497. [DOI] [PubMed] [Google Scholar]
- 36. Beydoun MA, Shroff MR, Beydoun HA, Zonderman AB. Serum folate, vitamin B12, and homocysteine and their association with depressive symptoms among U.S. adults. Psychosom Med. 2010;72:862–873. [DOI] [PMC free article] [PubMed] [Google Scholar]
- 37. Eussen SJ, Ferry M, Hininger I, Haller J, Matthys C, Dirren H. Five years changes in mental health and associations with vitamin B12/folate status of elderly Europeans. J Nutr Health Aging. 2002;6:43–50. [PubMed] [Google Scholar]
- 38. Sachdev PS, Parslow RA, Lux O, et al. Relationship of homocysteine, folic acid and vitamin B12 with depression in a middle-aged community sample. Psychol Med. 2005;35:529–538. [DOI] [PubMed] [Google Scholar]
- 39. Van Vranken M. Evaluation of microcytosis. Am Fam Physician. 2010;82:1117–1122. [PubMed] [Google Scholar]
- 40. Ramos MI, Allen LH, Haan MN, Green R, Miller JW. Plasma folate concentrations are associated with depressive symptoms in elderly Latina women despite folic acid fortification. Am J Clin Nutr. 2004;80:1024–1028. [DOI] [PubMed] [Google Scholar]