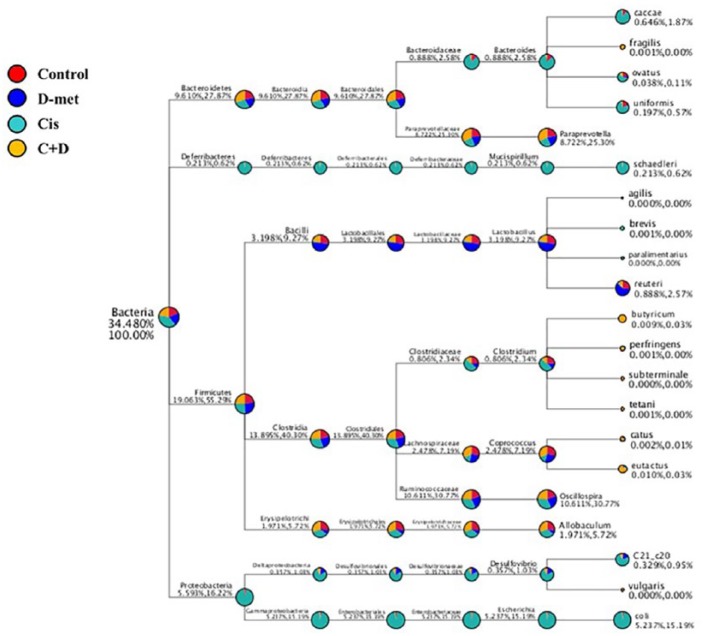
Figure 8.
Classification tree. The first circle represents the kingdom level (bacteria). The second circle (in same column) represents the phylum level. The subsequent order is class, order, family, genus and species. The first number (after the taxonomic ranks) represents the relative abundance of the whole corresponding taxon, while the second number represents the relative abundance of the corresponding taxon. For example, for Firmicutes (19.05%, 55.29%), 19.05% represents the proportion of this phylum among all phylum levels; 55.29% represents the proportion of this phylum among the four phylum levels.

