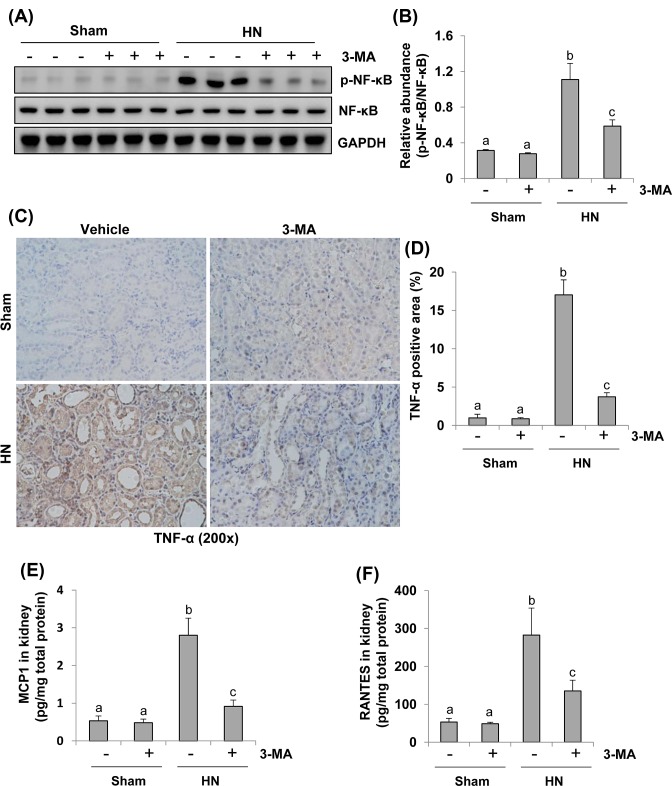
Figure 11. Inhibition of autophagy suppresses activation of NF-κB pathway and production of inflammatory cytokines in the kidney of hyperuricemic rats.
The kidney tissue lysates collected after 3 weeks of daily feeding of the mixture of adenine and potassium oxonate with or without 3-MA administration were subjected to immunoblot analysis with specific antibodies against p-NF-κB, NF-κB, and GAPDH (A). Expression levels of p-NF-κB were quantitated by densitometry and normalized with NF-κB (B). Photomicrographs (200×) illustrate TNF-α with immunohistochemical staining of the kidney tissues from sham or hyperuricemic rats treated/untreated with 3-MA (C). TNF-α positive area was counted in ten high-power fields and expressed as mean ± S.E.M. (D). Expression levels of MCP-1 determined by ELISA (E). Expression levels of RANTES determined by ELISA (F). Data are represented as the mean ± S.E.M. Means with different superscript letters are significantly different from one another (P<0.05).

