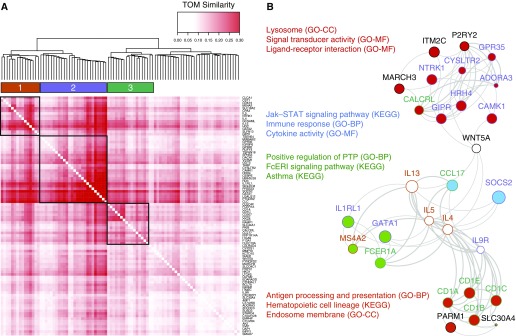
Figure 4.
A multicellular innate immunity network underlies asthmatic persistent type 2 inflammation. (A) Topological overlap measure (TOM) plot showing the subclusters of dark green network genes with highly correlated expression. The heat map is based on correlations of dissimilarity between genes. (B) FGNet enrichment results for the genes within the dark green module. The four enrichment metagroups are denoted by the fill of the node (gene) colors, where genes involved in multiple metagroups are filled in white. The gene subclusters identified in A are denoted by the node outline colors, where a black outline indicates that the gene was not within any of the three subclusters in A. FCeRI = high-affinity IgE receptor; GO-BP = Gene Ontology–Biological Process; GO-CC = Gene Ontology–Cellular Component; GO-MF = Gene Ontology–Molecular Function; KEGG = Kyoto Encyclopedia of Genes and Genomes; PTP = protein tyrosine phosphatase; STAT = signal transducer and activator of transcription.

