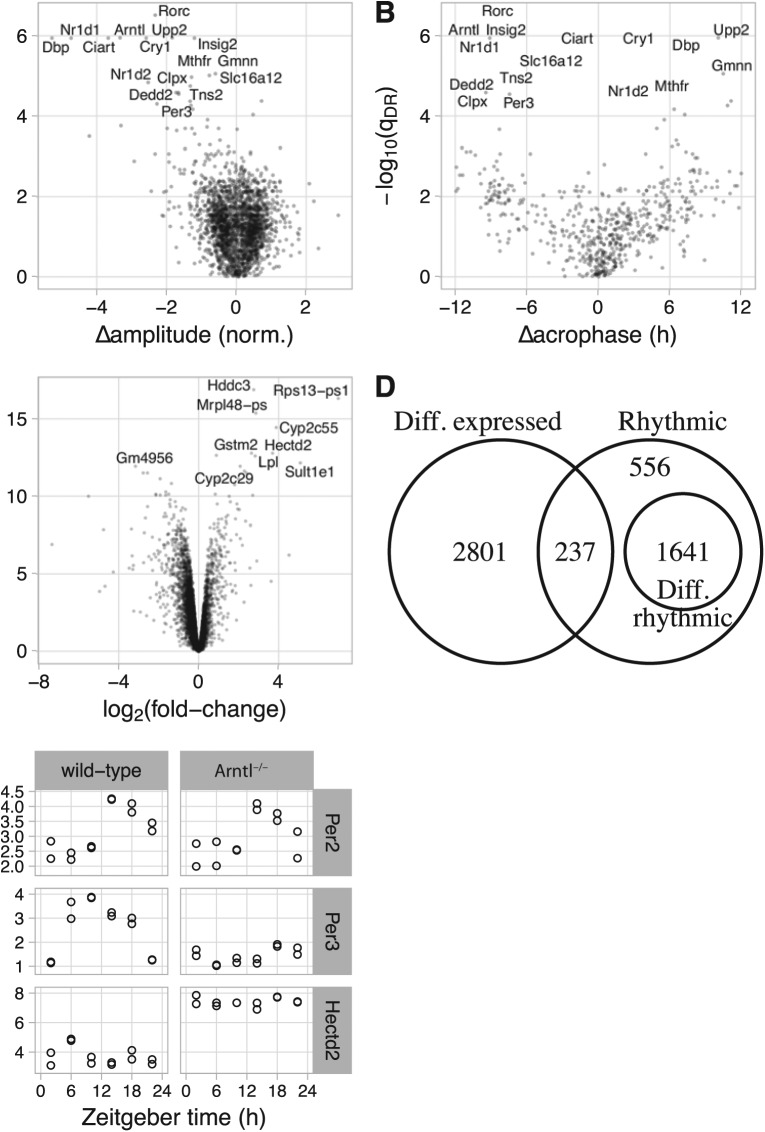
Figure 1.
Using LimoRhyde to analyze circadian transcriptome data from livers of wild-type and Arntl-/- mice under night-restricted feeding (GSE73552). (A) Scatterplot of -log10(qDR) vs. Δamplitude. qDR corresponds to a rhythmic gene’s q-value of differential rhythmicity. Δamplitude corresponds to the change in rhythm amplitude between genotypes, where a negative value indicates lower amplitude in Arntl-/-. In A-C, each point represents a gene. In A and B, the 16 rhythmic genes with the highest -log10(qDR) are labeled. (B) Scatterplot of -log10(qDR) vs. Δacrophase. The latter corresponds to the change in zeitgeber time of peak expression, where a positive value indicates a phase advance in Arntl-/-. Only genes with q-value for rhythmicity in both genotypes ⩽ 0.2 are shown. (C) Scatterplot of -log10(qDE) vs. log2 (fold-change). qDE corresponds to the q-value of differential expression. A positive log2 (fold-change) indicates higher average expression in Arntl-/-. The 10 genes with the highest -log10(qDE) are labeled. (D) Venn diagram of genes meeting criteria for rhythmicity (q-value of rhythmicity qrhy ⩽ 0.01), differential rhythmicity (qDR ⩽ 0.1), and differential expression (qDE ⩽ 0.1). (E) Plots of 3 example genes. Each point represents a sample. Based on the criteria, Per2 is classified as rhythmic only, Per3 as differentially rhythmic, and Hectd2 as differentially expressed only.

