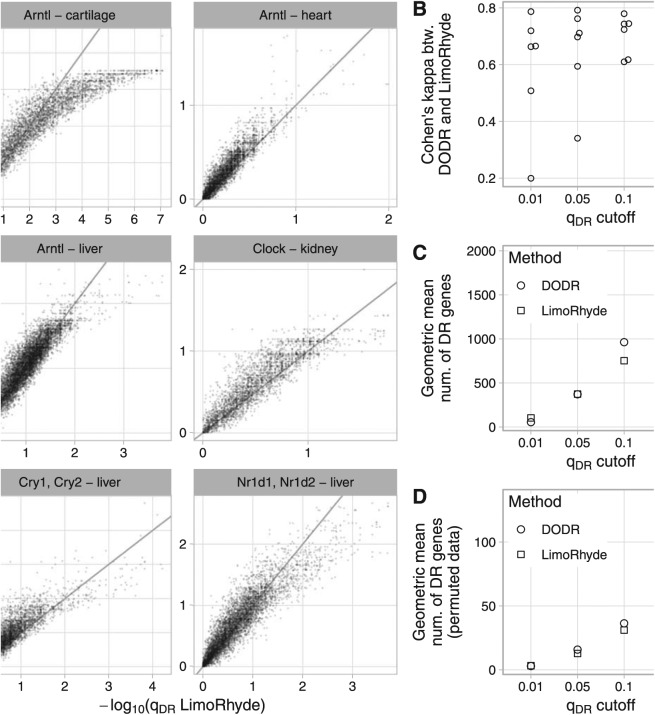
Figure 3.
Comparing LimoRhyde (followed by limma) and DODR for detecting differential rhythmicity (DR) between wild-type and clock gene knockout mice. For details of datasets, see Suppl. Table S1. In each dataset, rhythmic genes were identified using RAIN. (A) Scatterplots of q-value of differentially rhythmicity as calculated by each method. The title of each plot indicates the knocked-out gene(s) and the tissue in which gene expression was measured. Each point represents a rhythmic gene. The line indicates y = x. For each dataset, up to 15 genes with extremely high -log10(qDR LimoRhyde) are not shown. (B) Cohen’s kappa, a measure of inter-rater agreement, between DODR and LimoRhyde at various q-value cutoffs. Each point represents a dataset. (C) Geometric mean (across datasets) of the number of differentially rhythmic genes at various q-value cutoffs. (D) Geometric mean (across datasets) of the mean (across permutations) number of differentially rhythmic genes at various qDR cutoffs, in data in which the sample labels (wild-type or knockout) were permuted. Labels were permuted after identifying rhythmic genes, and were only permuted within samples at the same time point. Thus, DR genes identified in permuted data can be considered false positives for differential rhythmicity.

