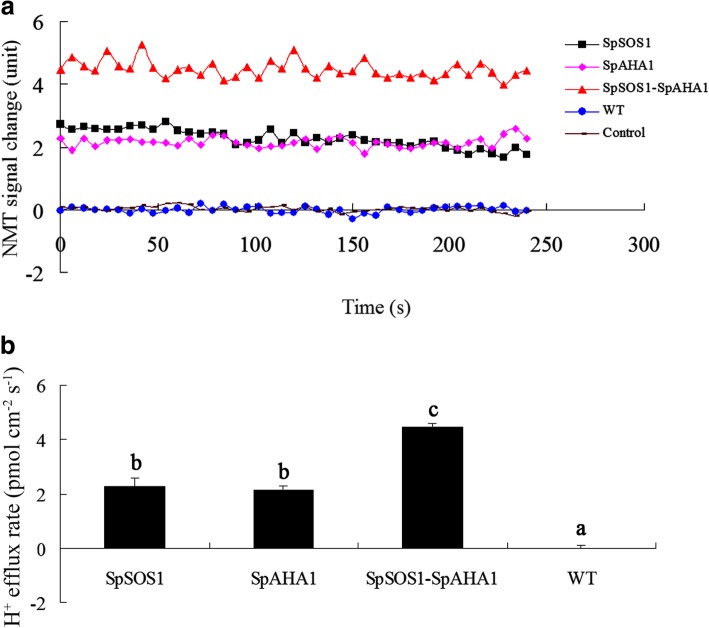
Fig. 3.
H+ flux in roots of NaCl-treated Arabidopsis plants. Seedlings were grown for 3 days on MS plates supplemented with 100 mM NaCl and then H+ flux in the roots was measured using the non-invasive micro-test technology (NMT) technique described in the Methods section. (a) Changes in the NMT signals are expressed as arbitrary units. (b) H+ flux is expressed as the amount of efflux per second per square centimeter (pmol•cm− 2•s− 1). Data are presented as mean ± SE of six replicates. Different letters above the columns indicate statistically significant differences at a p < 0.05 level among the different experimental cohorts. SpSOS1, SpSOS1-overexpressing plants; SpAHA1, SpAHA1-overexpressing plants; SpSOS1-SpAHA1, SpSOS1 and SpAHA1 co-expressing plants; WT, wild-type plants; Control, mock controls

