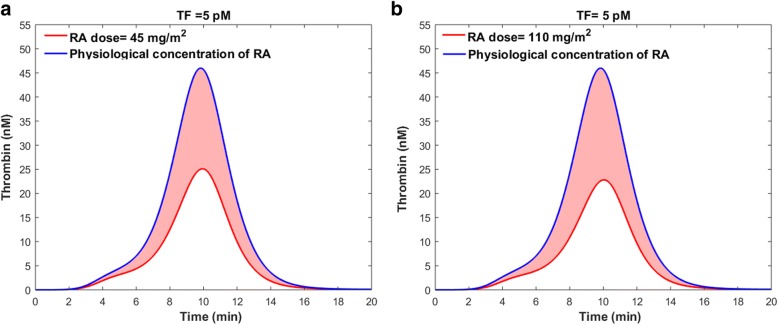
Fig. 13.
Impacts of RA-induced TM upregulation following drug ingestion (a) and (b) 110 , on thrombin generation. The blue lines indicate the thrombin generation profile in the control group with physiological levels of RA. The red lines show the maximum impact of RA therapy on thrombin generation. The shaded red regions indicate the range of the thrombin generation profile within three days of continuous RA therapy

