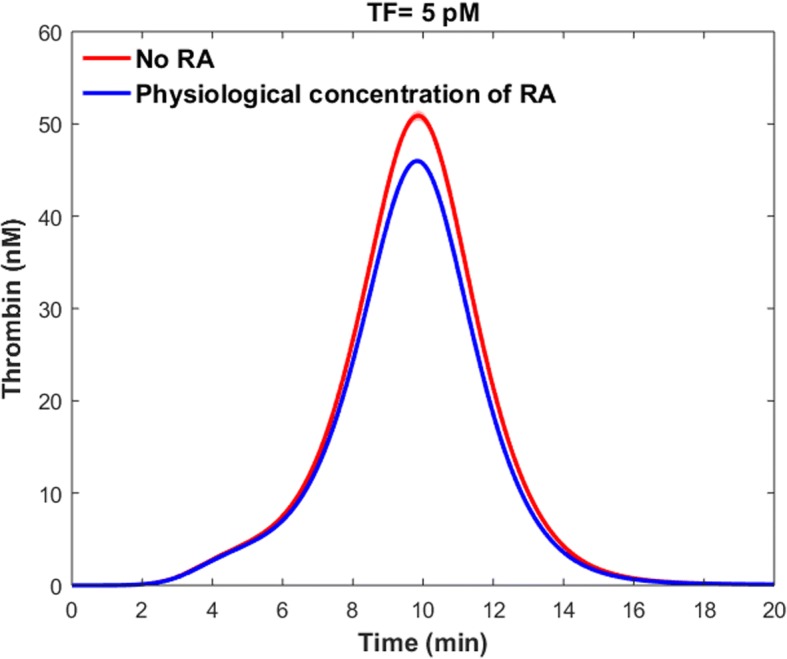
Fig. 15.

Impacts of physiological levels of RA on thrombin generation profile. The blue line indicates thrombin generation profile for the control condition with physiological level of RA. The red line shows the mean thrombin generation profile when there is no RA in the plasma. The shaded red region indicates the 99% confidence interval of the mean result
