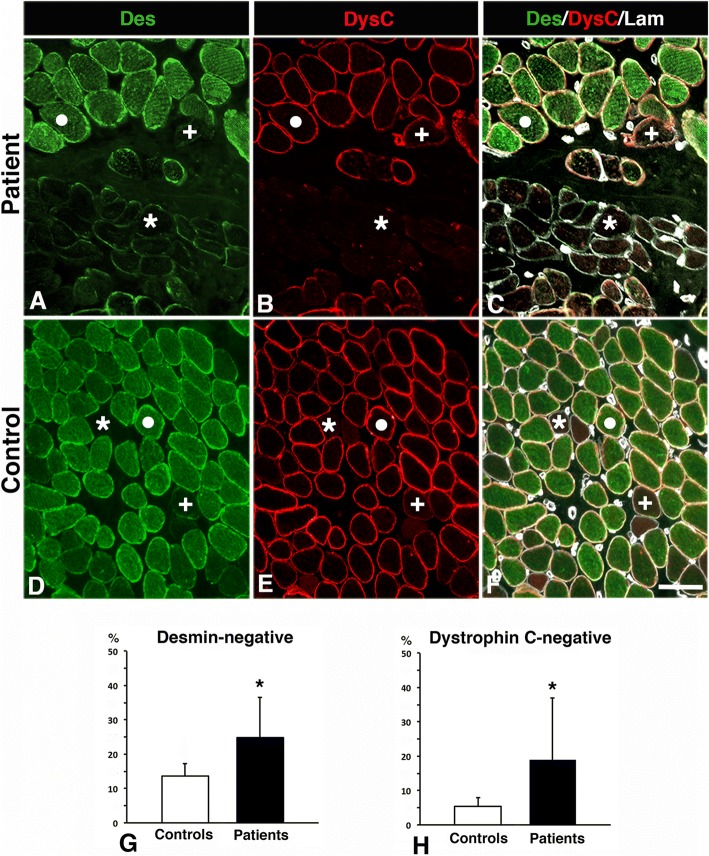
Fig. 2.
Muscle cross-sections from a patient (a-c) and a control (d-f) immunostained for desmin (Des, green colour, a, d), dystrophin C-terminus (DysC, red colour, b, e) and laminin (Lam, white colour, c, f). Panels C and F show merged staining. Normal expression of desmin and dystrophin (white dot), desmin-negative fibres (+) and desmin and dystrophin C-terminus-negative fibres (*). Scale bar 50 μm. Graphs g and h shows the percentage of desmin and dystrophin C-terminus negative fibres in controls and patients (mean and SD). A significant difference (p < 0.05) is marked (*)

