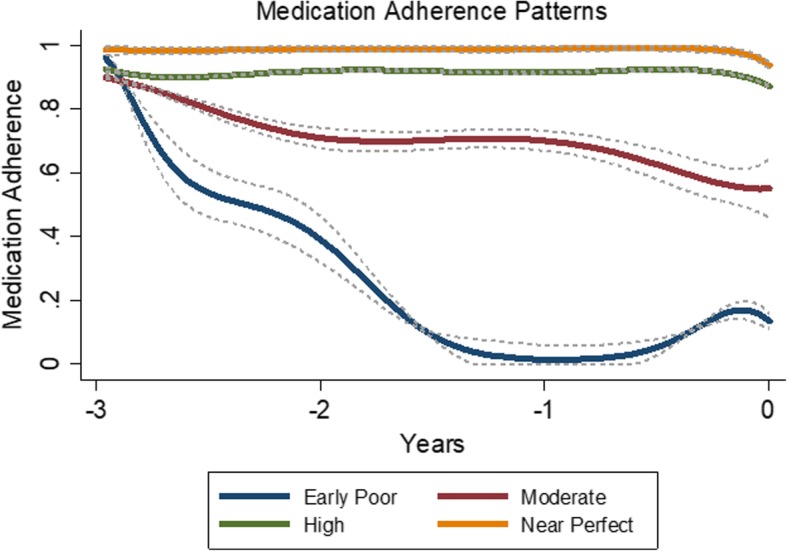
Fig. 2.

Antihypertensive Adherence Trajectories over 3 Years: Dementia Cases and Non-Dementia Controls Combined (N = 4182). a Each individual was assigned to one trajectory group based on the probabilities of individual membership in each trajectory group generated from the model. We used a censored normal model for the 15-day average PDC to accommodate the excess of zeroes and ones at the scale minimum and maximum. Group-based trajectory modeling suggested a 4-group solution for antihypertensive users. The 4 medication adherence trajectories and their 95% confidence intervals are displayed in the Figure. Trajectory groups are labeled based on appearance to aid interpretation. b Trajectory group prevalence included near perfect (n = 1877, 37% cases, 46% controls), high (n = 1840, 43% cases, 44% controls), moderate (n = 365, 18% cases, 8% controls) and early poor adherence (n = 100, 1.7% cases, 2.4% controls)
