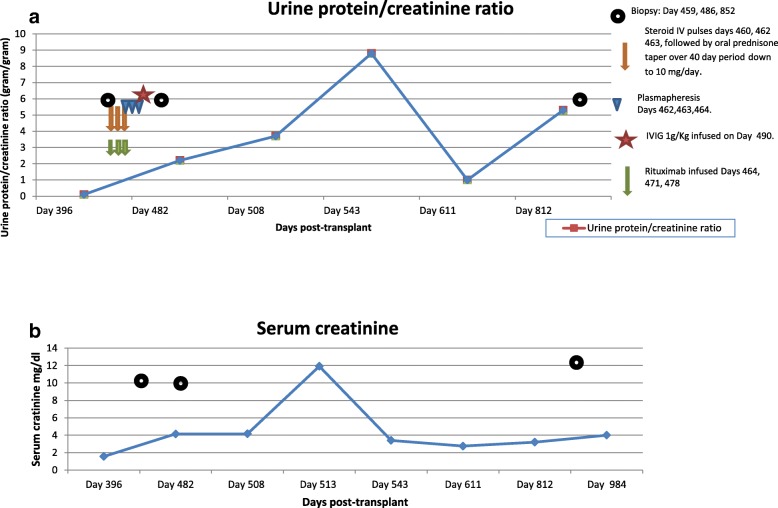
Fig. 1.
a Graph of patient’s post-transplant urine protein measurements at presentation, expressed as urine protein/creatinine ratios and days post-transplant. The timing of treatment with corticosteroids, Rituximab, plasmapheresis and intravenous immunoglobulin (IVIG) is shown. b Graph of patient’s post-transplant serum creatinine levels at presentation. Values during the period of graft dysfunction are shown

