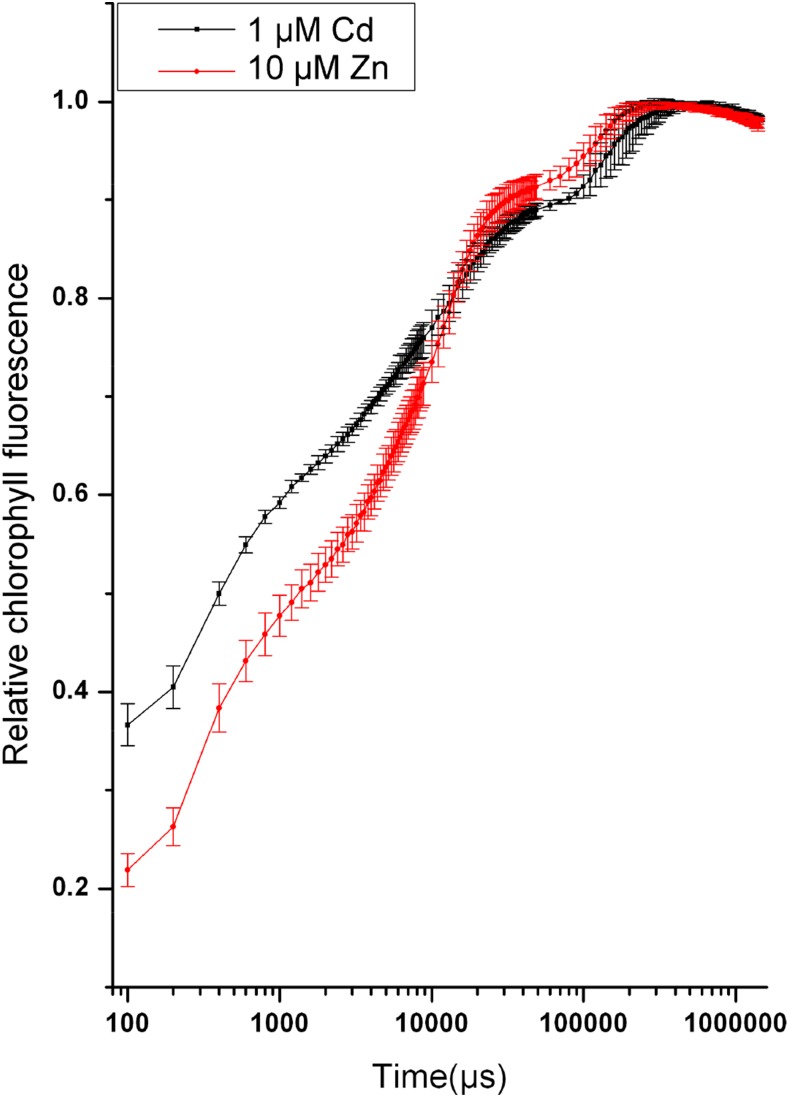
Figure 1.
Kinetic representation (mean value ± se, n = 4) of the OJIP transients from N. ochroleucum leaves that were treated with 1-μM Cd + 10-µM Zn or only 10-μM Zn for three months. These measurements were obtained with the microscopic direct fast imaging system after 5-min dark adaptation and with a supersaturating flash of ∼1,300 μmol.m−2.s−1 photon flux density as described in more detail in “Materials and Methods.” In this and all following figures showing kinetic traces from imaging measurements, the traces for each selected area represent the average of all pixels within that area. Note the different shapes of the curves for Cd-stressed and control (10 μM Zn, 0 nm Cd) leaves.

