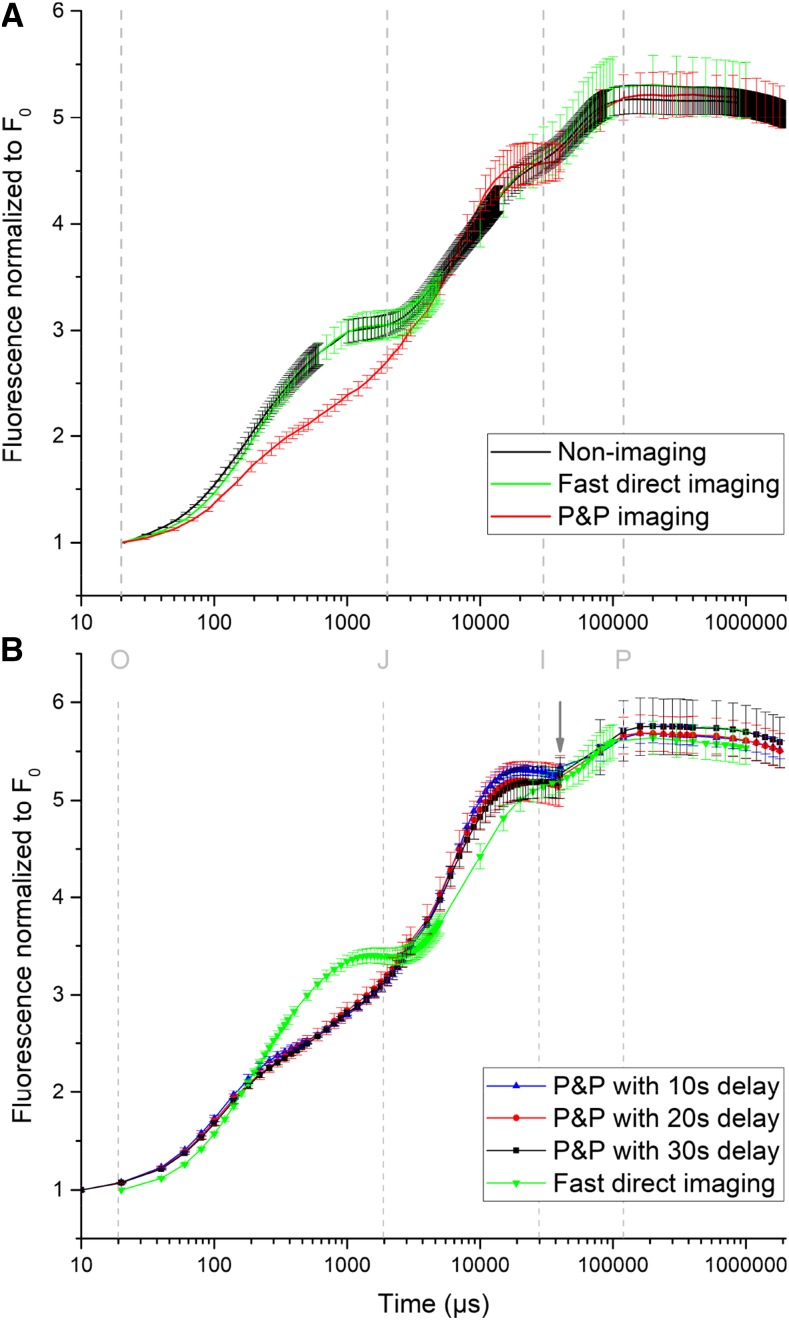
Figure 2.
Comparison of different OJIP measuring methods using Arabidopsis leaves. All measurements were obtained after 5-min dark adaptation with a blue supersaturating light of ∼3,500 μmol.m−2.s−1 photon flux density as described in more detail in “Materials and Methods.” The gray dashed lines and letters show the timepoints of the OJIP steps as defined by Stirbet and Govindjee (2011). A, Comparison of nonimaging direct measurement, imaging measurement with P&P, and fast direct imaging. The values represent the average ± sd of five independent measurements (leaves of similar age on different plants). B, Comparison of different delay times for the P&P sequences with fast direct imaging. The values represent the average ± sd of four independent measurements (leaves of similar age on different plants). The arrow shows the switch from P&P to direct measurement at 40 ms.

