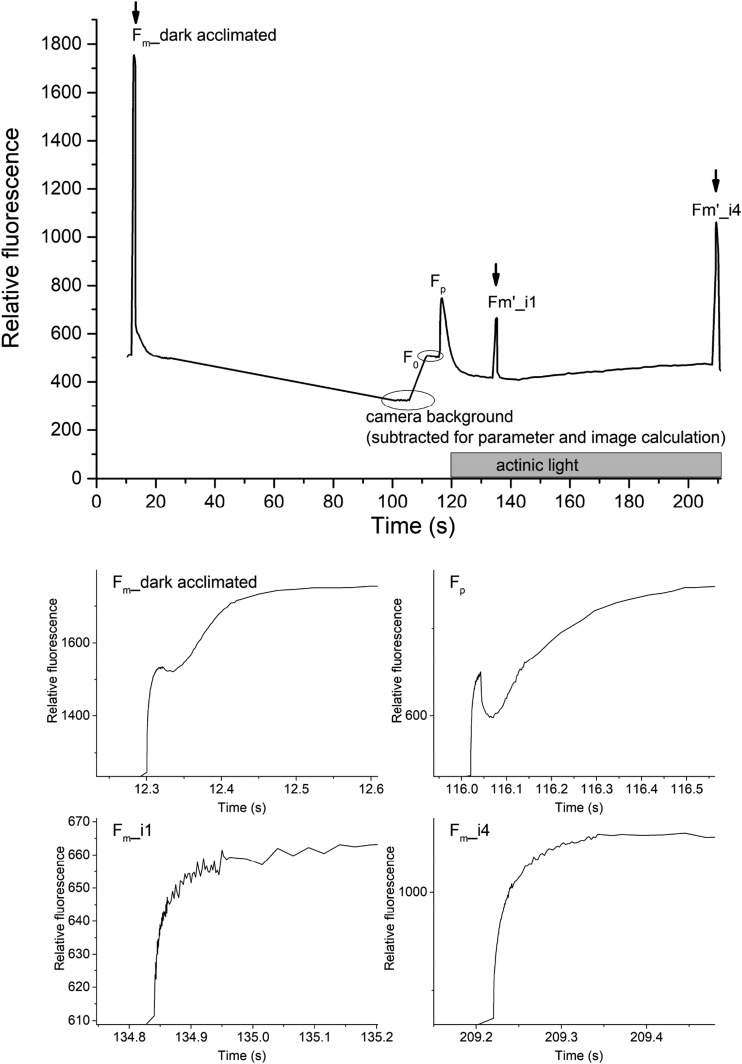
Figure 8.
Overview of a multi-OJIP protocol for analyzing the changes of electron transport within and after PS II in the phase of adaptation to actinic light. The period of actinic light is indicated by a gray box, and the supersaturating flashes by arrows, in the main graph. The shape of the fluorescence rises of each peak are shown below the main graph. The measured sample was a young-mature leaf of the Cd/Zn hyperaccumulator N. caerulescens grown with replete (nontoxic) 100 μM Zn2+ for three months. The graphs shown represent a typical example.

