Figure 2.

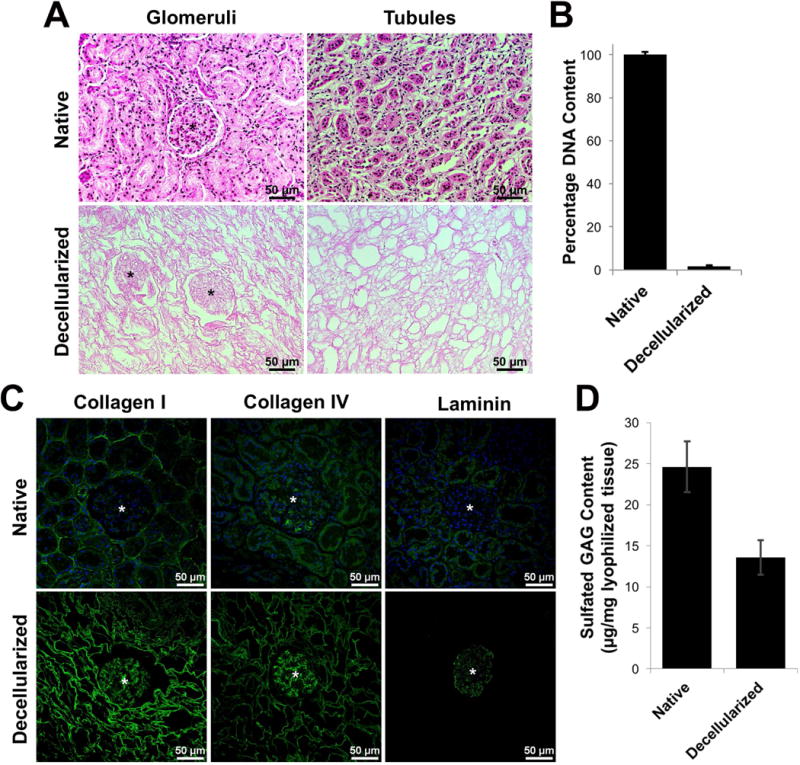
Evaluation and characterization of decellularized kidney tissues. (A) Routine hematoxylin and eosin staining of native and decellularized kidney sections demonstrating removal of cellular nuclei (dark spots) and preservation of the ECM architecture, including glomeruli (*) and tubule structures. (B) Quantification of double-stranded DNA content in native and decellularized kidney tissue. DNA content was normalized to the dry weight of each sample, and data is presented as a percentage of native kidney tissue DNA content (n = 3). (C) Immunofluorescence staining of native and decellularized kidney sections demonstrating retention of collagen I, collagen IV, and laminin in decellularized tissues; glomerular structures indicated by (*). (D) Quantification of sulfated glycosaminoglycan content in native and decellularized kidney tissue. sGAG content was normalized to the dry mass of each sample with samples run in triplicate (n = 3).
