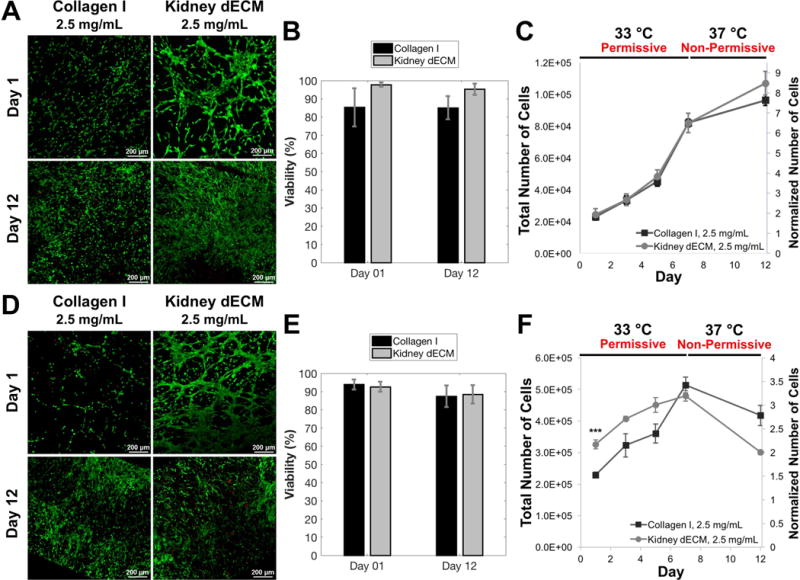
Figure 4.

Viability and proliferation of human GEnCs cultured on collagen I hydrogels and kidney dECM hydrogel substrates (A-C) or encapsulated within hydrogels (D-F). (A) Live/dead staining and confocal imaging of GEnCs cultured on collagen I hydrogels or kidney dECM hydrogels at days 1 and 12. (B) Quantification of viability of cells cultured on top of hydrogel substrates presented as the percentage live cells from image analysis. (C) Quantification of cultured GEnC proliferation over twelve days using a Quant-iT PicoGreen dsDNA Assay Kit. Normalized values (right axis) were normalized to the number of cells seeded per sample on day 0. Samples initially seeded with 12,500 cells per sample (50,000 cells/mL). Number of independent measurements, n = 4. (D) Live/dead staining and confocal imaging of GEnCs encapsulated within collagen I hydrogels or kidney dECM hydrogels at days 1 and 12. (E) Quantification of viability of cells encapsulated within hydrogels presented as the percentage live cells from image analysis. (F) Quantification of encapsulated GEnC proliferation over twelve days using a Quant-iT PicoGreen dsDNA Assay Kit. Normalized values (right axis) were normalized to the number of cells encapsulated per sample on day 0. Samples initially seeded with 150,000 cells per sample (1 million cells/mL). Number of independent measurements, n = 4. *** p < 0.005.
