
Figure 1B: Prevalence of most frequently cultured bacteria by age groups across all sites and sample types.
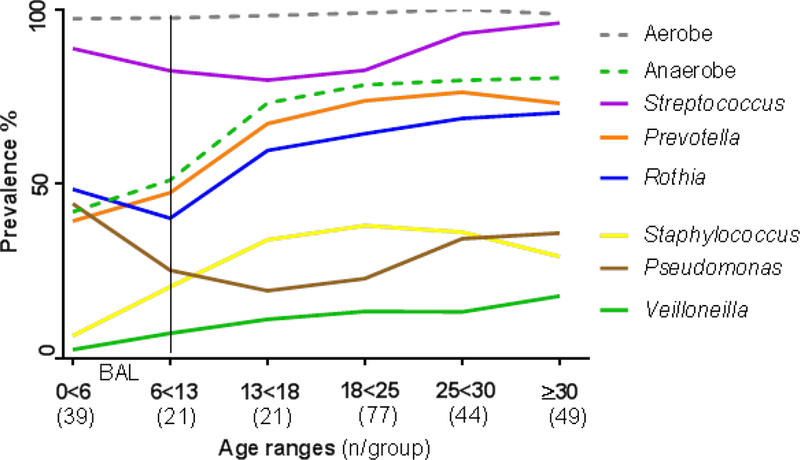
Prevalence for most prevalent bacteria are shown by age groups/range in years. The number of samples for each group is provided in parenthesis. Only BAL samples are included in subjects <6 years, as indicated by the vertical line.