
Figure 2: Prevalence as percent of subjects with any CFU/g sputum for a) Anaerobes, b) Haemophilus, c) Staphylococcus, and d) Pseudomonas in sputum and their association with clinical characteristics.
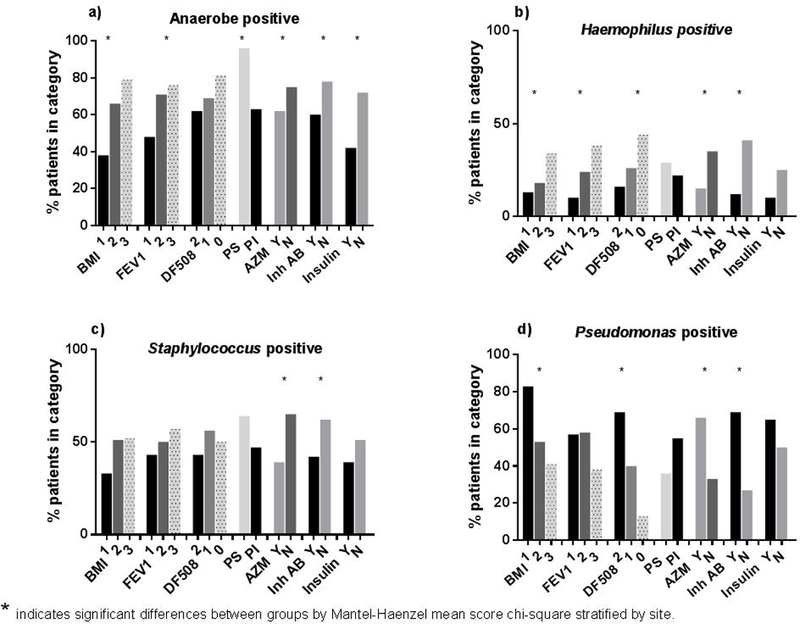
BMI are 1 - poor nutritional status; 2 - adequate; 3 - well-nourished. Categories for FEV1 are 1: <40% predicted; 2: 40-80%; 3: >80%. Numbers per category are given as percentage of subjects positive for this characteristic. Comparisons are by Mantel-Haenzel mean score chi-square test stratified by site.