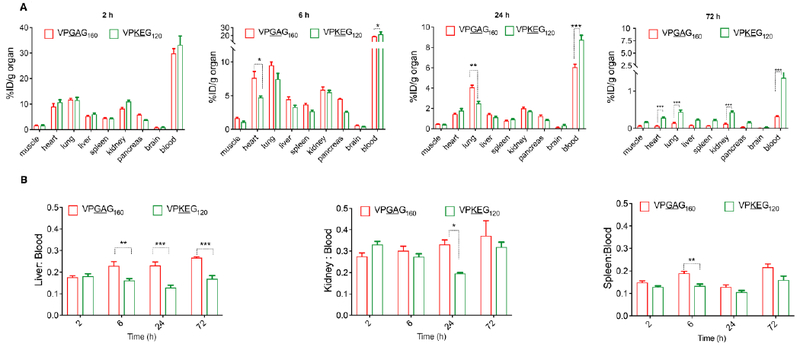
Figure 4. Biodistribution of ZIPPs.

A. Biodistribution of ELP and ZIPP after i.v. injection at 2 h, 6 h, 24 h and 72 h revealed that there is not a large difference in organ distribution between ZIPP and ELP, with a few exceptions at several time points that are marked in the figure. Data shown as mean ± SE (n=3-4). (*p<0.05, ** p<0.01, ***p<0.0001, unpaired t-test). B. Retention of ELP and ZIPP in the organs of the reticuloendothelial system (RES) expressed as organ to blood ratio, calculated by normalizing the amount present in each organ to that in the blood. Each bar is the mean ± SE (n=3-4). (*p<0.05, **p<0.01, ***p<0.0001, unpaired t-test).
