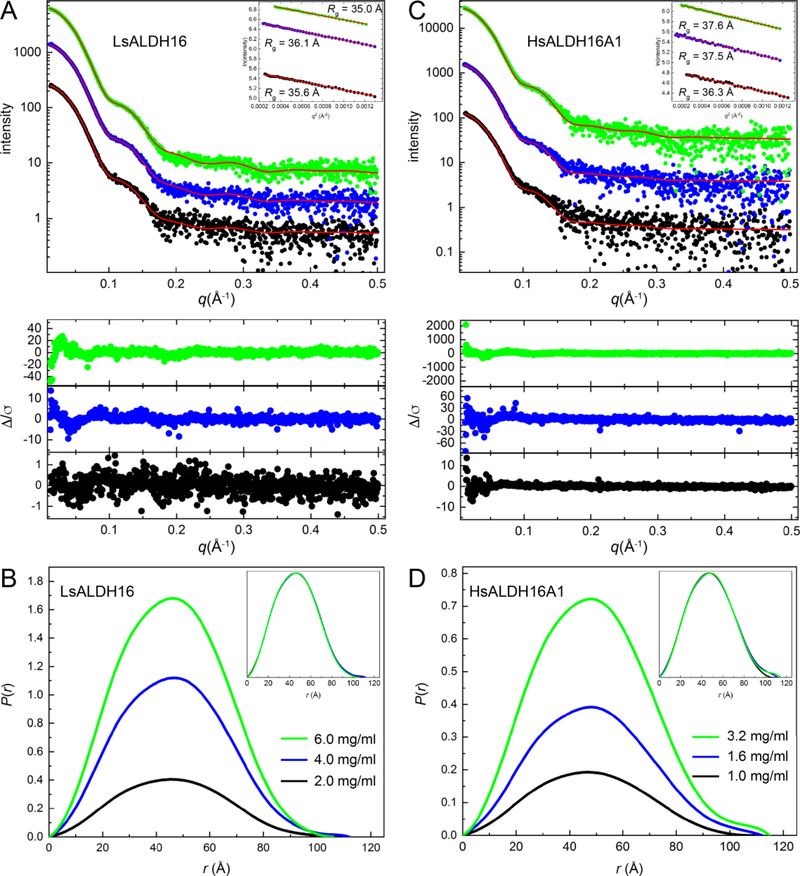
Fig. 4.
SAXS analysis of ALDH16. (A) SAXS curves for LsALDH16 collected at three protein concentrations. The dots are experimental data colored as follows: black, 2.0 mg/ml; blue, 4.0 mg/ml; green, 6.0 mg/ml. The SAXS data have been arbitrarily scaled for ease of presentation. The red curves are theoretical SAXS profiles calculated from the crystallographic homodimer with FoXS [59]. The lower inset shows error-weighted residual plots for the FoXS fits. The upper inset shows Guinier plots. (B) SAXS experimental distance distribution functions for LsALDH16. The inset shows the normalized P(r) plots. (C) SAXS curves for HsALDH16A1 collected at three protein concentrations. The dots are experimental data colored as follows: black, 1.0 mg/ml; blue, 1.6 mg/ml; green, 3.2 mg/ml. The SAXS data have been arbitrarily scaled for ease of presentation. The red curves are theoretical SAXS profiles calculated by FoXS from a dimer homology model of HsALDH16A1 based on the LsALDH16 crystallographic dimer. The lower inset shows error-weighted residual plots for the FoXS fits. The upper inset shows Guinier plots. (D) SAXS experimental distance distribution functions for HsALDH16A1. The inset shows the normalized P(r) plots.

