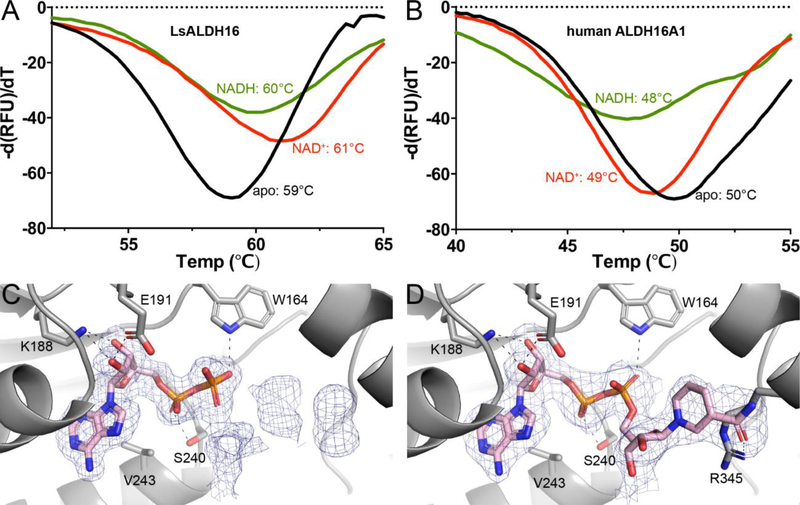
Fig. 6.
Cofactor binding to ALDH16. (A) Fluorescence thermal shift data for LsALDH16 in the absence of cofactor (black), the presence of 5 mM NAD+ (red), or the presence of 5 mM NADH (green). (B) Fluorescence thermal shift data for HsALDH16A1 in the absence of cofactor (black), the presence of 5 mM NAD+ (red), or the presence of 5 mM NADH (green). The data in panels A and B represent the average from three experiments and are plotted with negative of the first derivatives of relative fluorescence units as a function of temperature. (C) Electron density evidence for NAD+ bound to LsALDH16. (D) Electron density evidence for NADH bound to LsALDH16. The cages in panels C and D represent polder omit maps (3σ) [60].

