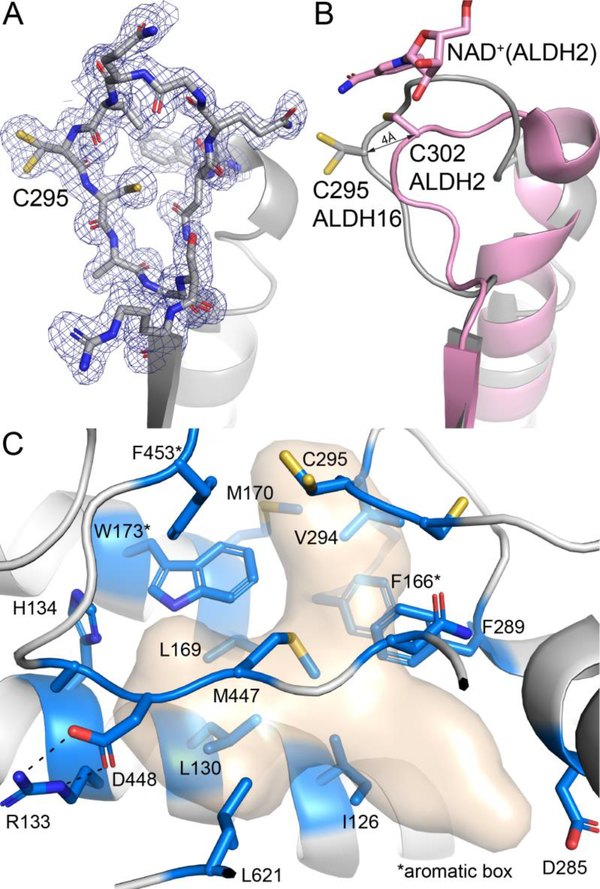
Fig. 9.
The active site of LsALDH16. (A) 1.65 Å resolution electron density for the catalytic loop of the NAD+ complex (polder omit, 3σ). (B) Comparison of the catalytic loops of LsALDH16 (gray) and ALDH2 (pink). (C) Residues in the predicted aldehyde binding site of LsALDH16. The surface represents the region likely occupied by aldehyde substrates as deduced from structures of ALDHs complexed with products and inhibitors (PDB 6ALJ, 6B5H, 5FHZ, and 4ZUL). Residues in blue line the predicted aldehyde cavity. Note the preponderance of nonpolar residues lining the cavity.

