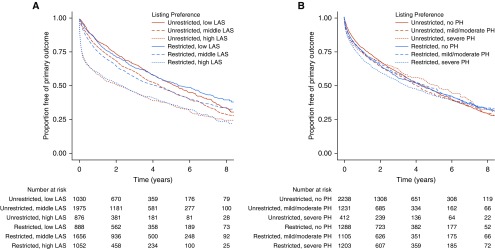
Figure 4.
Kaplan-Meier survival curves for the composite primary intention-to-treat outcome (time from listing until death before or after transplantation, removal from the waiting list because of clinical deterioration, or retransplantation) among participants with interstitial lung disease (ILD) stratified by (A) lung allocation score (LAS), and (B) severity of pulmonary hypertension (PH). Numbers below each panel are the number of subjects at risk at each time point. Low LAS = listing LAS within the lowest tertile of listing LAS for this cohort; middle LAS = listing LAS within the middle tertile of listing LAS for this cohort; high LAS = listing LAS within the highest tertile of listing LAS for this cohort; mild PH = mean pulmonary artery pressure ≥ 25 but <30; moderate PH = mean pulmonary artery pressure ≥ 30 but <35; severe PH = mean pulmonary artery pressure ≥ 35.

