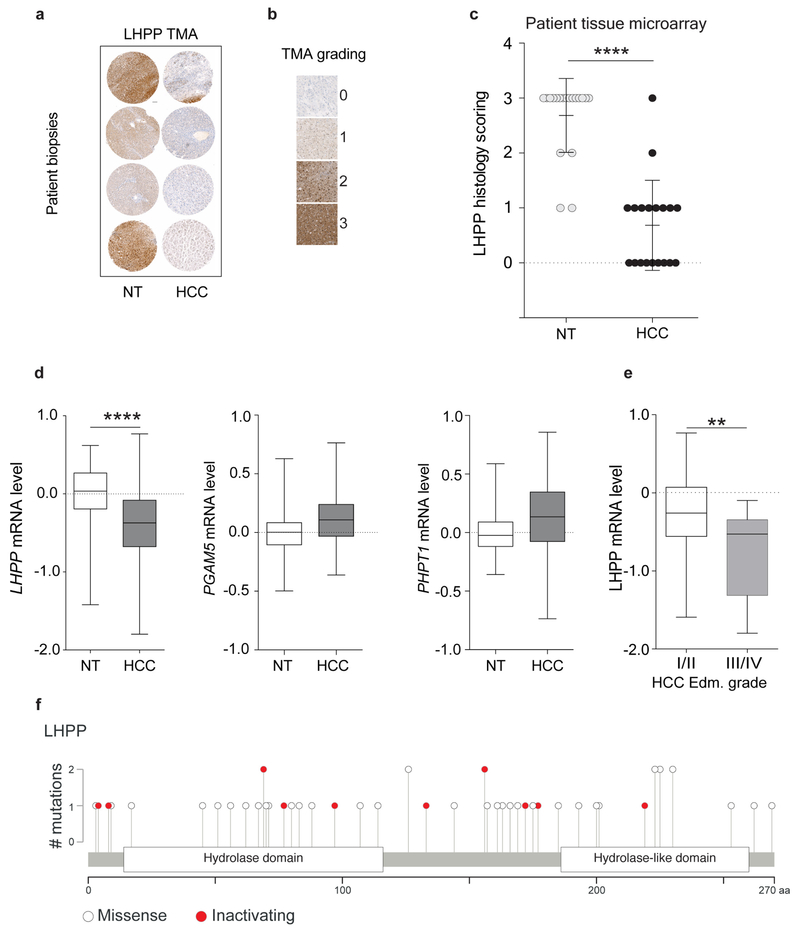
Extended Data Figure 6 |. LHPP is a tumour suppressor in human HCC.
a, Representative immunohistochemistry images from the LHPP-stained tissue microarray. Scale bar, 100 μm. b, Representative images and staining intensities of LHPP staining in the tissue microarray. c, Tissue microarray (TMA) indicates that LHPP is significantly downregulated in human HCC compared to adjacent non-tumour tissue (n = 20 HCC patients, ****P < 0.0001, two-sided paired t-test). d, Box plots showing a significant reduction in LHPP expression in HCC tissue compared to adjacent non-tumour tissue (n = 59). ****P < 0.0001, two-sided Mann-Whitney U test. Non-tumour (minimum, −1.422, median, 0.03329, maximum, 0.6179, lower 95% confidence interval (CI) of mean −0.0931, upper 95% CI of mean 0.0931) and HCC (minimum, −1.797, median, −0.3729, maximum, 0.7683, lower 95% CI of mean −0.5328, upper 95% CI of mean −0.2506). Expression of PHPT1 and PGAM5 was not reduced in HCC. e, Box plots showing a strong reduction in LHPP expression in Edmondson grade III/IV tumours (aggressive tumours, n = 17) compared to Edmondson grade I/II tumours (less aggressive tumours, n = 42).**P = 0.0036, two-sided Mann-Whitney U test. Edmondson grade I/II (minimum, −1.592, median, −0.2594, maximum 0.7683, lower 95% CI of mean −0.3987, upper 95% CI of mean −0.0986) and III/IV (minimum, −1.797, median, −0.5281, maximum, −0.09671, lower 95% CI of mean −1.018, upper 95% CI of mean −0.4717). f, Lollipop plot showing the distribution of mutations in LHPP across pan-cancer datasets in the TCGA and ICGC portal. Solid white circles indicate missense mutations, red circles indicate inactivating mutations (including nonsense mutations, splice site mutations and frameshift deletions; detailed list of mutations is provided in Supplementary Table 5).

