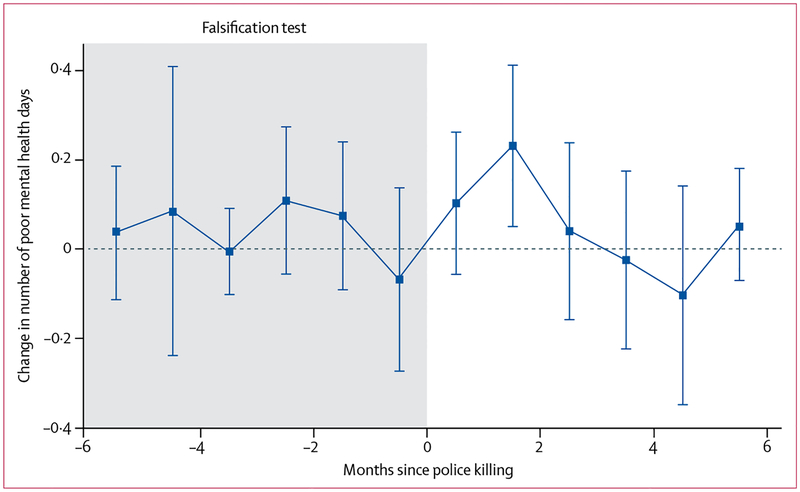
Figure 1: Changes in the number of poor mental health days in the 6 months before and after exposure to police killings of unarmed black Americans.
The figure displays coefficients for the association between the number of police killings of unarmed black Americans (in the same state as the respondents) and the mental health of black respondents 6 months on either side of the shooting. Vertical bars indicate 95% CIs. Estimates in the shaded region represent the impacts of a police killing on mental health outcomes assessed within the 6 months before the police killing event (ie, falsification test).

