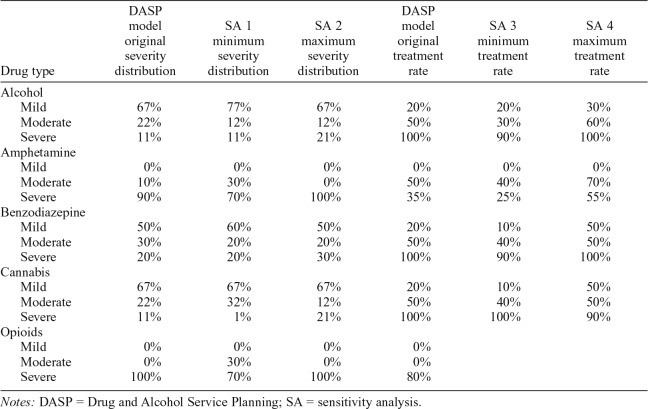
Table 3.
Sensitivity analyses: summary of variations to be tested
| Drug type | DASP model original severity distribution | SA 1 minimum severity distribution | SA 2 maximum severity distribution | DASP model original treatment rate | SA 3 minimum treatment rate | SA 4 maximum treatment rate |
| Alcohol | ||||||
| Mild | 67% | 77% | 67% | 20% | 20% | 30% |
| Moderate | 22% | 12% | 12% | 50% | 30% | 60% |
| Severe | 11% | 11% | 21% | 100% | 90% | 100% |
| Amphetamine | ||||||
| Mild | 0% | 0% | 0% | 0% | 0% | 0% |
| Moderate | 10% | 30% | 0% | 50% | 40% | 70% |
| Severe | 90% | 70% | 100% | 35% | 25% | 55% |
| Benzodiazepine | ||||||
| Mild | 50% | 60% | 50% | 20% | 10% | 50% |
| Moderate | 30% | 20% | 20% | 50% | 40% | 50% |
| Severe | 20% | 20% | 30% | 100% | 90% | 100% |
| Cannabis | ||||||
| Mild | 67% | 67% | 67% | 20% | 10% | 50% |
| Moderate | 22% | 32% | 12% | 50% | 40% | 50% |
| Severe | 11% | 1% | 21% | 100% | 100% | 90% |
| Opioids | ||||||
| Mild | 0% | 0% | 0% | 0% | ||
| Moderate | 0% | 30% | 0% | 0% | ||
| Severe | 100% | 70% | 100% | 80% |
Notes: DASP = Drug and Alcohol Service Planning; SA = sensitivity analysis.

