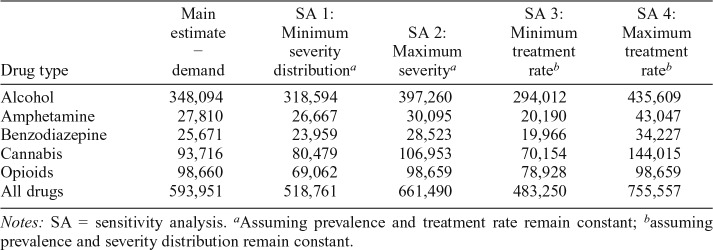
Table 4.
Predicted/modeled demand (number of people receiving treatment in the course of 1 year) main estimate and sensitivity analyses
| Drug type | Main estimate − demand | SA 1: Minimum severity distributiona | SA 2: Maximum severitya | SA 3: Minimum treatment rateb | SA 4: Maximum treatment rateb |
| Alcohol | 348,094 | 318,594 | 397,260 | 294,012 | 435,609 |
| Amphetamine | 27,810 | 26,667 | 30,095 | 20,190 | 43,047 |
| Benzodiazepine | 25,671 | 23,959 | 28,523 | 19,966 | 34,227 |
| Cannabis | 93,716 | 80,479 | 106,953 | 70,154 | 144,015 |
| Opioids | 98,660 | 69,062 | 98,659 | 78,928 | 98,659 |
| All drugs | 593,951 | 518,761 | 661,490 | 483,250 | 755,557 |
Notes: SA = sensitivity analysis.
Assuming prevalence and treatment rate remain constant;
assuming prevalence and severity distribution remain constant.

