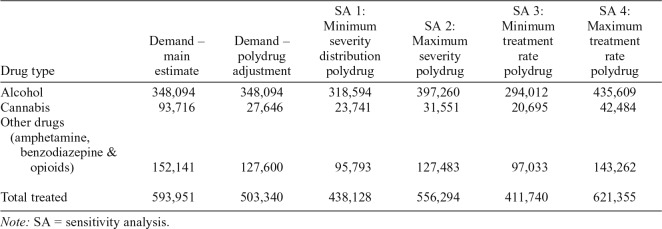
Table 5.
Predicted/modeled demand estimate and sensitivity analyses taking into account polydrug use
| Drug type | Demand – main estimate | Demand – polydrug adjustment | SA 1: Minimum severity distribution polydrug | SA 2: Maximum severity polydrug | SA 3: Minimum treatment rate polydrug | SA 4: Maximum treatment rate polydrug |
| Alcohol | 348,094 | 348,094 | 318,594 | 397,260 | 294,012 | 435,609 |
| Cannabis | 93,716 | 27,646 | 23,741 | 31,551 | 20,695 | 42,484 |
| Other drugs (amphetamine, benzodiazepine & opioids) | 152,141 | 127,600 | 95,793 | 127,483 | 97,033 | 143,262 |
| Total treated | 593,951 | 503,340 | 438,128 | 556,294 | 411,740 | 621,355 |
Note: SA = sensitivity analysis.

