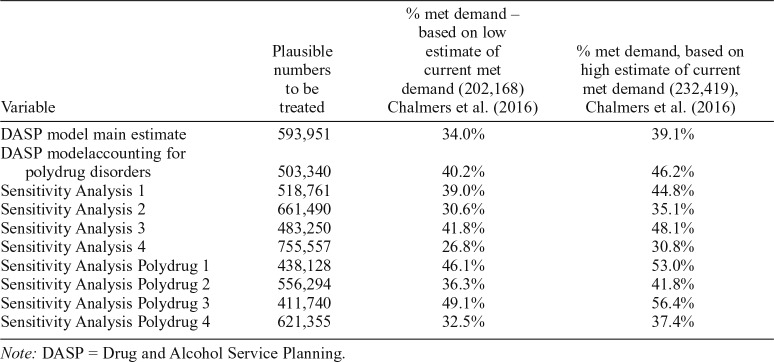
Table 6.
Extent of potential met demand
| Variable | Plausible numbers to be treated | % met demand – based on low estimate of current met demand (202,168) Chalmers et al. (2016) | % met demand, based on high estimate of current met demand (232,419), Chalmers et al. (2016) |
| DASP model main estimate | 593,951 | 34.0% | 39.1% |
| DASP modelaccounting for polydrug disorders | 503,340 | 40.2% | 46.2% |
| Sensitivity Analysis 1 | 518,761 | 39.0% | 44.8% |
| Sensitivity Analysis 2 | 661,490 | 30.6% | 35.1% |
| Sensitivity Analysis 3 | 483,250 | 41.8% | 48.1% |
| Sensitivity Analysis 4 | 755,557 | 26.8% | 30.8% |
| Sensitivity Analysis Polydrug 1 | 438,128 | 46.1% | 53.0% |
| Sensitivity Analysis Polydrug 2 | 556,294 | 36.3% | 41.8% |
| Sensitivity Analysis Polydrug 3 | 411,740 | 49.1% | 56.4% |
| Sensitivity Analysis Polydrug 4 | 621,355 | 32.5% | 37.4% |
Note: DASP = Drug and Alcohol Service Planning.

