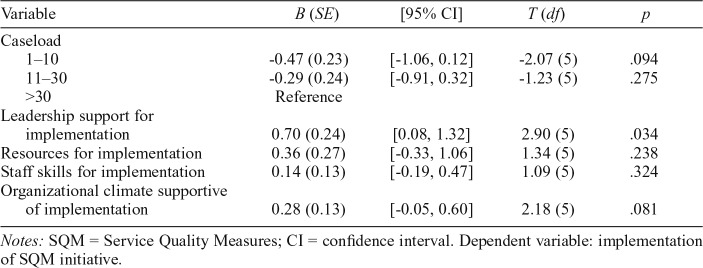
Table 3.
General linear regression model of SQM system implementation
| Variable | B (SE) | [95% CI] | T (df) | p |
| Caseload | ||||
| 1–10 | -0.47 (0.23) | [-1.06, 0.12] | -2.07 (5) | .094 |
| 11–30 | -0.29 (0.24) | [-0.91, 0.32] | -1.23 (5) | .275 |
| >30 | Reference | |||
| Leadership support for implementation | 0.70 (0.24) | [0.08, 1.32] | 2.90 (5) | .034 |
| Resources for implementation | 0.36 (0.27) | [-0.33, 1.06] | 1.34 (5) | .238 |
| Staff skills for implementation | 0.14 (0.13) | [-0.19, 0.47] | 1.09 (5) | .324 |
| Organizational climate supportive of implementation | 0.28 (0.13) | [-0.05, 0.60] | 2.18 (5) | .081 |
Notes: SQM = Service Quality Measures; CI = confidence interval. Dependent variable: implementation of SQM initiative.

