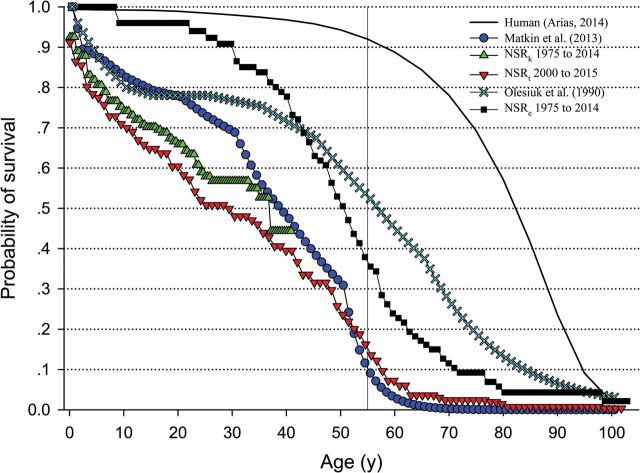
Fig. 2.
Kaplan–Meier survival curves for known-age northern resident (NR) and southern resident (SR) killer whales (▲, NSR k ) from 1 January 1975 to 1 January 2014, estimated and known-age NR and SR killer whales (▼, NSR t ) from 1 January 2000 to 1 January 2014, and estimated age NR and SR killer whales from 1 January 1975 to 1 January 2014 (□, NSR e ). Survival curves created from published probabilities for the female southern Alaskan resident killer whales (□— Matkin et al. 2013 ), female NR and SR killer whales (NSR) from 1973 to 1987 (— Olesiuk et al. 1990 ), and United States human females in 2010 (black line— Arias 2014 ). Data from Olesiuk et al. (1990) were recently used to compare PRLS between humans and killer whales by Foote (2008) , Johnston and Cant (2010) , and Croft et al. (2015) . Note that the vertical line at 55 years (i.e., 1 interbirth interval plus 2 SD s from the mean age at last parturition— Cohen 2004 ) represents the age at which greater than 5% of the female killer whale population must survive in order to indicate significant PRLS for the species.

