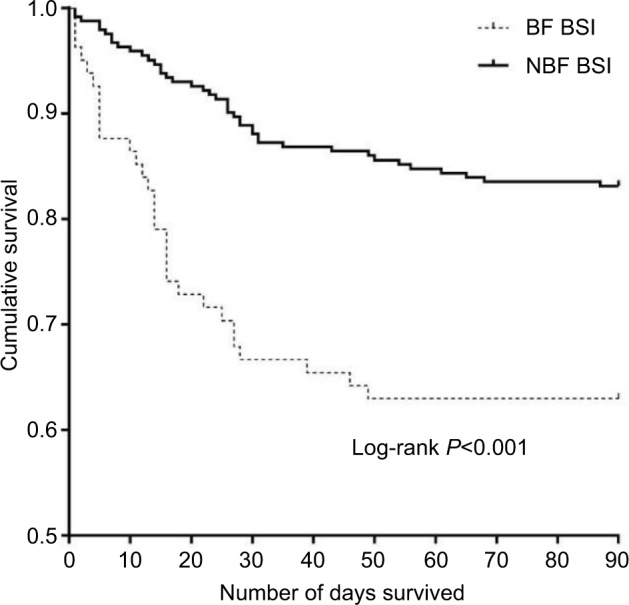
Figure 2.

Survival analysis of EC-caused BSI in cancer patients with/without BF.
Notes: The Kaplan–Meier curve shows the survival curves until day 90 for the two infection groups. The mortality risk was higher among the cancer patients with BF-positive EC-caused BSIs compared with those with BF-negative EC-caused BSIs (P<0.001).
Abbreviations: BF, biofilm formation; BSI, bloodstream infection; EC, Escherichia coli; NBF BSI, BF-negative EC-caused bloodstream infections.
