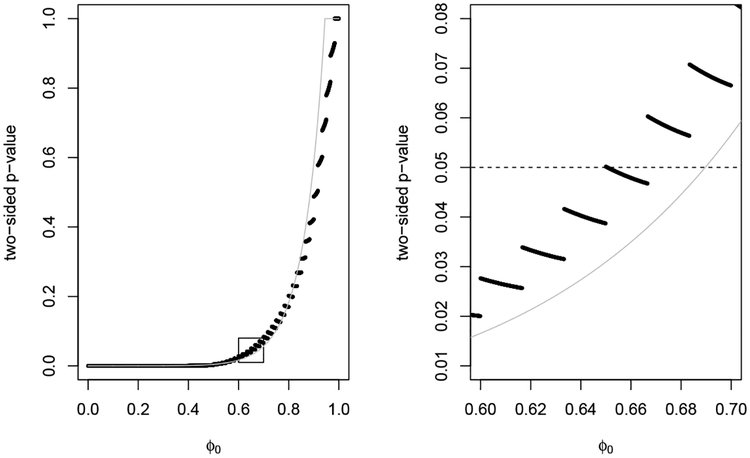
Figure 2:
Two-sided p-values for x = [1, 2, 3, 4, 5] and y = [6, 7, 8, 9, 10, 11]. Black dots are the absolute value method and the gray line is the central method. The 95% confidence region for the absolute value method is (0.6500, 0.6505) ∪ (0.6667, 1), while the one for the central method is (0.6897, 1).

