
Figure 1.
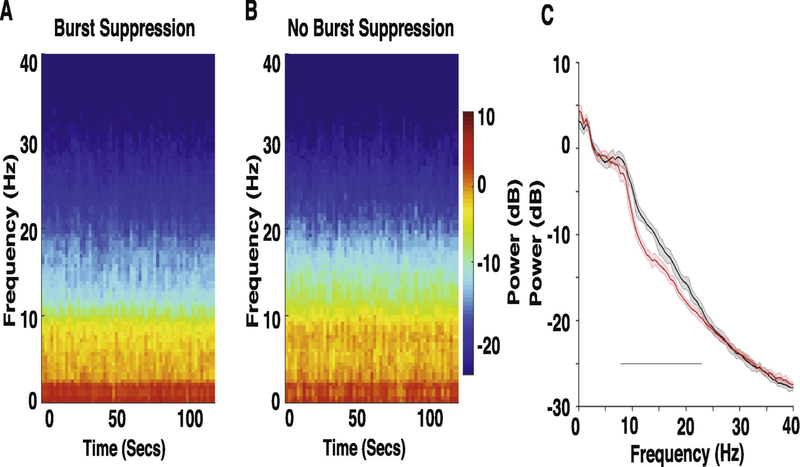
Spectral comparison of EEG obtained prior to the onset of CPB in the CPB Burst suppression versus CPB No Burst suppression cohorts. (A, B) Median frontal spectrograms of Burst suppression (n = 27) and No Burst suppression (n = 27) patient cohorts. (C) Overlay of median Burst suppression (red) and median No Burst suppression (black) frontal spectra. Bootstrapped median spectra are presented, and the shaded regions represent the 95% confidence interval for the uncertainty around each bootstrapped median spectrum. We observed differences in power between the spectra (No Burst suppression > Burst suppression: 7.8–22.95 Hz). Black line represents significantly different regions.