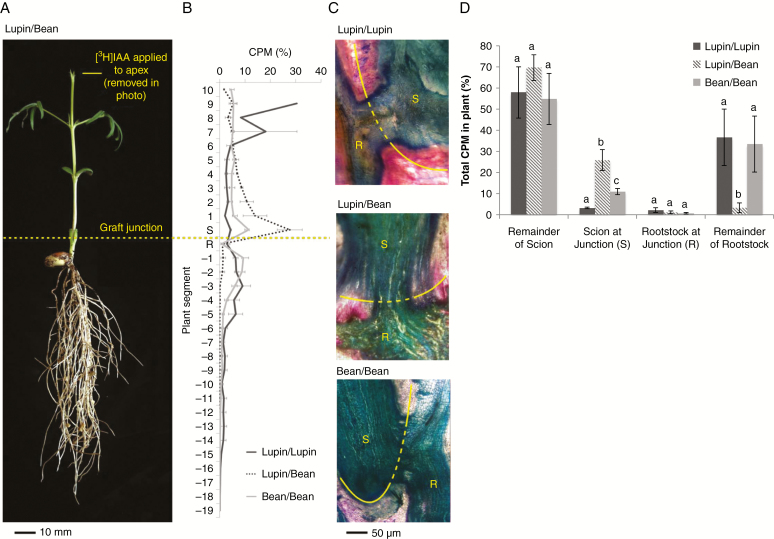
Fig. 3.
Vascular development and transport of [3H]indole-3-acetic acid (IAA) in lupin and broadbean 18 d after grafting. (A) Photograph of a typical lupin/broadbean (scion/rootstock) wedge graft. (B) Percentage of radiolabel (% CPM, counts per minute) in 1 cm segments of plants 20 h after the application of 37 000 Bq 3H-labelled IAA in 1 μL of ethanol to the intact apex. (C) Longitudinal sections of the graft junctions stained with toluidine blue and safranin O. The graft junctions (yellow line) between the scions (S) and the rootstocks (R) are indicated. (D) Percentages of radiolabel recovered from the scion (excluding the apex and the section immediately above the graft junction), the scion immediately above the graft junction (S), the rootstock immediately below the graft junction (R) and the remainder of the rootstock are shown. Within-tissue values with different letters are significantly different (one way-ANOVA and Tukey’s HSD test, P < 0.05). For (B) and (D), values are the mean ± s.e. (n = 3). Grafts and transport experiments were carried out as described in Foo et al. (2015).

