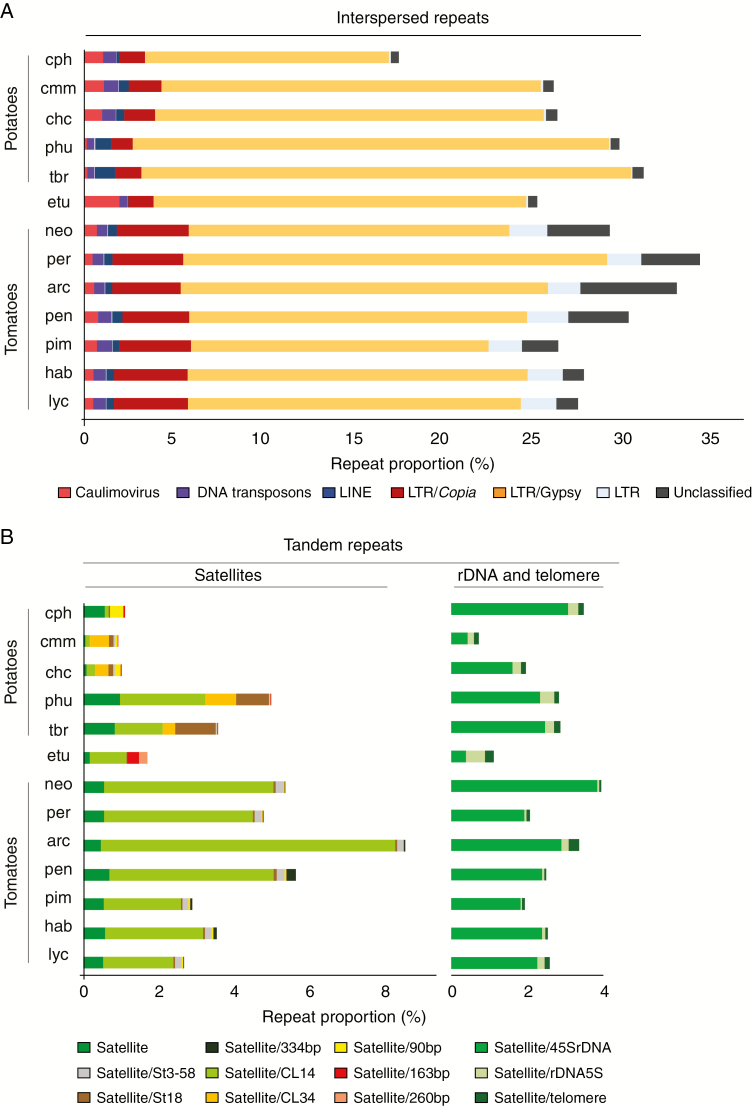
Fig. 2.
All-to-all similarity comparison of sequence reads from Solanum species based on cluster composition across all 13 species included in this study. The bar plots show the size of the repetitive fraction of the genome, represented as a percentage of each genome. Different colours represent different repeat families. (A) Relative abundance of interspersed repeats. (B) Relative abundance of tandem repeats. See Table 1 for species codes.

