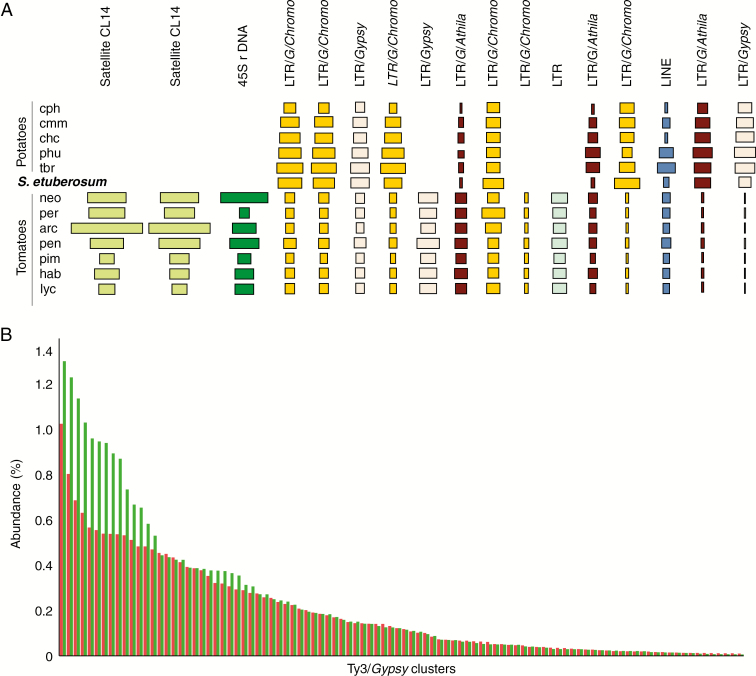
Fig. 3.
(A) Sequence composition of the largest 17 clusters derived from the comparative analysis across all 13 species of Solanum included in this study. The size of the rectangle is proportional to the number of reads in a cluster for each species. Colours of the rectangles correspond to repeat type. See Table 1 for species codes. (B) Relative abundance of clusters containing LTR elements of the Ty3/Gypsy type, arranged from the largest to the smallest clusters in potato species (green bars) and tomato species (red bars).

