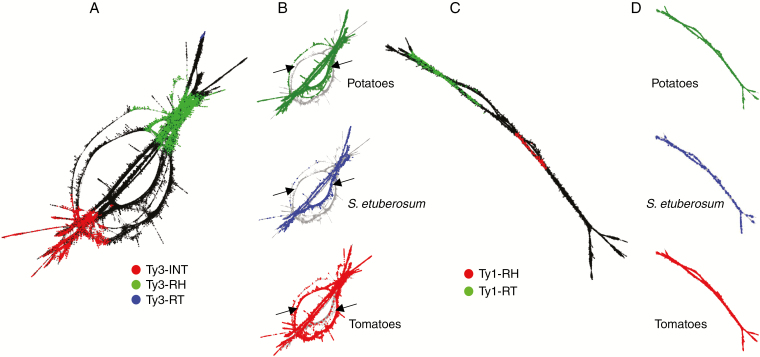
Fig. 4.
Repeat sequence differentiation across clades for LTR elements. (A,C) Cluster graph layout (Novák et al., 2010) representation of (A) Ty3/Gypsy Chromovirus cluster CL005 and (C) of Ty1/Copia cluster CL025 from the comparative analysis across all species. Sequence reads are represented by nodes of the graph and reads with identity of at least 90 % with minimal overlap of 55 % are connected by lines. Reads are coloured based on their similarity to conserved coding domains of LTR retrotransposons. (B,D) Nodes of the graph are coloured based on their species of origin in the comparative analysis across all species. The parts of the graphs that represent the most variable sequence regions in (B) the CL5 element and (C) the CL25 element, which can differentiate between clades, are indicated by black arrows. These variants are evident as narrow parallel paths on the graph representation.

